
 English
 简体中文
简体中文 Français
 Español
This post is also available in: Chinese (Simplified) French Spanish
What a difference a year makes! Our team last wrote about the high yield (HY) energy industry on 9 March 2020, following the collapse of talks among the oil-producing countries of the OPEC+ alliance (Organization of the Petroleum Exporting Countries, plus its allies Russia and other major oil producing countries). The accompanying graphic to that blog post of a thunderstorm—while certainly ominous—in hindsight may not have gone far enough to foreshadow the considerable storm the market was about to face. Just over a year ago on 20 April 2020, oil market volatility reached a crescendo when the West Texas Intermediate (WTI) crude oil benchmark price closed at a negative price of US$37.63 per barrel. The outperformance of US HY energy in the year following that historic event has been dramatic: +44% total return for HY energy versus +15% for the HY ex-Energy and Metals & Mining Index.1
HY energy remains an important and topical industry for the US HY market, currently accounting for over 13% of the overall HY index. Despite a run of strong outperformance, energy still offers well in excess of 100 basis points2 of yield and spread pickup relative to the balance of the HY market. In this piece, we outline some notable events in US HY energy since the onset of the pandemic and outline how the industry has changed.
2020: The Year of the Energy Fallen Angel
After the March 2020 collapse in oil prices, credit ratings agencies moved quickly to reduce credit ratings or downgrade ratings outlooks for many issuers in the energy industry. Over the course of 2020, this pushed the credit ratings of several energy issuers down to HY from Investment Grade (IG)—so-called ‘Fallen Angels’. The exploration & production (E&P) subindustry was hit particularly hard, with a handful of large issuers downgraded to HY. Currently, 2020’s cohort of E&P Fallen Angels comprises just over 50% of the HY E&P subindustry.3
Most outstanding bonds of these Fallen Angel issuers are IG-style with bullet maturities, which means these bonds largely lack the issuer-friendly call features typical of many HY bonds. In addition, some of the outstanding debt of the Fallen Angels have maturities well into the 2030s or 2040s—offering much longer duration than is typical in new-issue bonds in the HY market. This combination of call protection and duration in some Fallen Angel bonds can provide the potential for upside bond price appreciation in instances of considerable credit quality improvement, such as an upgrade back to IG. This is particularly notable in a HY market that has appreciated such that price upside potential is increasingly constrained by call features in aggregate.
Throughout 2020, we favoured some of these Fallen Angels given the quality of their asset bases coupled with the long-term potential for these issuers to return to investment grade.
The Pandemic Shock Pushed the Most Vulnerable HY Energy Issuers into Bankruptcy
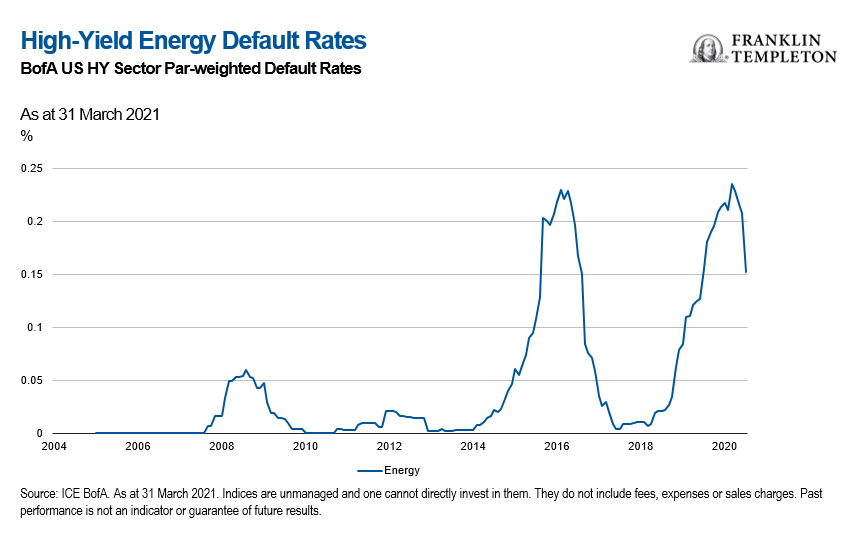
Not only did the collapse in oil prices lead to credit rating downgrades, but it also tipped many of the most vulnerable HY energy issuers into bankruptcy. According to Bank of America (BofA), the trailing 12-month default rate for the energy industry peaked in November 2020 at nearly 24%. (See chart below)
Credit Rating Quality of HY Energy—Especially the E&P Sub-Industry—Has Improved Considerably
With the addition of formerly IG companies and the subtraction of the weakest links through defaults, the composition of the HY energy index changed significantly throughout 2020. As of 20 April 2021, roughly 66% of the BAML HY Energy universe by market value was rated BB (vs. 54% of the entire HY universe).4 This compares to just 45% at year-end 2019 (vs. 49% for the entire HY universe).5
The change in composition is even more extreme in the case of HY E&P. As of April 20, 2021, 73% of HY E&P was rated BB, up dramatically versus just 39% at year-end 2019. Moreover, if we look back to April 2019, just 27% of HY E&P was rated BB.6
Despite a wave of defaults and issuers leaving the HY market, with the introduction of Fallen Angels, E&P today is 6.5% of the overall HY market, versus 5.1% at year-end 2019, and thus remains an important subindustry within HY energy.7 On the other hand, the size of the volatile oil field equipment & services subindustry in the HY index was cut in half. Due to defaults and deeply distressed issuers, this subindustry is now down to 1.2% of the overall HY market versus 2.5% at year-end 2019.8
Outside of E&P, the other major subindustry of energy is midstream. This subindustry currently accounts for 5.0% of the overall HY market, up from 4.4% at year-end 2019.9 The growth was driven by inclusion of a small number of Fallen Angels, including two issuers that are or were related parties of E&P Fallen Angels. Given the contractual nature of many of the subindustry’s pipeline, gathering and processing systems, the financial results of this subindustry are typically less volatile than the rest of HY energy. As a consequence of these financial characteristics, this subindustry largely avoided the heavy defaults experienced in the E&P and oil field equipment & services subindustries. Moreover, the ratings of this group in recent years tilted toward the BB category, with over three-quarters of the midstream industry currently rated BB—relatively unchanged versus year-end 2019. 10
We have found attractive investment opportunities in the midstream subindustry over time when the market was fixated on this subindustry being part of the broader energy ecosystem rather than focusing on the underlying fundamental credit quality of individual companies.

An Unexpected Beneficiary of the Pandemic: Natural Gas E&Ps
Going into 2020, many market participants were concerned about the financial viability of HY E&Ps that primarily produce natural gas and natural gas liquids (NGLs). Today, this cohort of natural gas-focused producers account for roughly 20% of the HY E&P universe. In oil-focused shale plays such as the prolific Permian Basin, so-called ‘associated’ natural gas and NGLs are produced in tandem with oil. Associated gas is often viewed by oil-focused producers as a nuisance by-product that generates a small fraction of overall revenue but requires meaningful investment in infrastructure and processing capacity to offload. Reflecting this, natural gas at the Waha hub in West Texas at times traded at a negative price in recent years.
Pre-pandemic, low or negative prices for natural gas did not impact the economics of the oil-focused producers enough to slow those producers’ pace of oil production growth. As a result, US natural gas production from the shale oil basins grew considerably and without much sensitivity to what this flood of supply did to natural gas prices. This surge in supply pressured natural gas prices down to levels that at times challenged the economics of drilling new wells in natural gas-focused basins.
However, the shock to the oil markets in 2020 resulted in considerably lower drilling activity from oil-focused E&Ps. According to natural gas and NGL producer Antero Resources, from early March 2020 to mid-February 2021, the number of rigs drilling for oil in US oil-focused basins was down 55%.11 This reduction in drilling activity resulted in a moderate decline in production of associated natural gas and NGLs over that time frame (compared to robust growth in prior years). For context, Antero notes these oil-focused basins account for 25% of US natural gas and 68% of NGL production. As a consequence of the change in market expectations for associated gas supply growth, the medium-to-long-term outlook for natural gas and NGL supply/demand balance and prices has improved, leading to better market sentiment and trading levels for the bonds of many natural gas and NGL-focused E&Ps.
A Credit-Friendly Wave of E&P Merger & Acquisition Activity and more Disciplined Capital Allocation Policies
In recent months, several E&P industry mergers and acquisitions were announced. A common theme in these deals was the desire for management teams to strengthen balance sheets and reduce cost of debt capital. Most of these deals were largely equity-financed transactions at little to no premium for shareholders of the targets. However, the bonds of the HY E&P companies involved in the transactions often traded considerably higher on the news. In many cases, the target company was a HY issuer while the acquiror was an IG issuer, or ratings agencies signalled the combined company would likely be IG-rated.
In addition to the wave of M&A in the E&P industry, the management teams of many publicly traded E&Ps have finally heeded investors’ demands for free cash flow generation and more moderate production growth. This credit-friendly capital allocation stance could lead to improved credit profiles for the E&P industry and could eliminate the need for many E&P companies to access the debt capital markets to finance growth.
The capital allocation framework of the midstream industry has also broadly trended towards credit-friendly policies. As the US E&P industry’s production growth has slowed, the need for midstream companies to raise debt to fund new infrastructure projects has declined. Additionally, some midstream companies have prioritised debt repayment over distributions to equity holders, a departure from more aggressive financial policies in the past.
Environmental, Social and Governance (ESG) Considerations Increasingly Front-of-Mind for HY Energy Investors
As with many recent trends, we believe investors’ focus on ESG considerations accelerated and intensified in 2020. Given meaningful attention on the ‘E’ in ESG by the markets, the oil & gas industry is naturally top-of-mind for investors focused on ESG considerations. Moreover, the early emphasis by US President Joe Biden’s administration on broad climate-related issues created some volatility in the market for some HY energy issuers and underscored the need for investors to keep ESG a core tenet of fundamental credit research. For example, Biden’s announcement to revoke the permit for the Keystone XL pipeline and to introduce a pause on granting new oil and gas leases on federal lands and waters introduced uncertainty for some HY energy issuers.
Recently, President Biden announced a new target for the United States to cut greenhouse gas emissions to at least 50% below 2005 levels by 2030. According to the US Environmental Protection Agency (EPA), in 2019 the major categories of emissions were transportation (29%), electricity generation (25%) and industry (23%).12 To put Biden’s target in context, EPA data shows US emissions in 2019 were 12% below 2005 levels. Over that time frame, emissions from electricity generation declined by 33%—in part due to abundant and affordable natural gas that displaced coal as a source of electricity generation. We await more specific details as to how Biden’s plan is intended to achieve the goal, though a statement from the White House indicated the plan will utilise multiple pathways to reduce emissions across all sectors.
At a high level, Biden’s plan for the transportation sector calls for reduced tailpipe emissions and improved efficiency of cars and trucks, funding for electric vehicle charging infrastructure, investment in very low-carbon renewable fuels, and investment in transportation infrastructure. It remains to be seen how exactly the plan will be implemented, how realistic the goal is, or the ultimate impact on oil demand.
Policies such as these will keep the debate about the timing of global peak oil demand top of mind for oil & gas investors and make it important to keep a close eye on government policies globally regarding the energy sector. In our analysis of the oil & gas industry and the industry’s high-yield issuers, we certainly keep in mind the demand challenges for oil over the very long term, and ultimately the impact on the terminal value of assets such as oil refineries and in-the-ground oil reserves. This is one aspect of the many considerations we factor into our fundamental research on the industry to identify attractive investment opportunities.
Over the last few years, we have observed HY energy companies increasingly taking ESG considerations seriously. Not only has disclosure of environmental data improved considerably for the HY energy industry in aggregate, but increasingly issuers are genuinely working to improve environmental metrics such as emissions and routine flaring of natural gas, and in some cases management compensation has some ties to improved environmental performance. We believe regulators such as the US Securities and Exchange Commission are likely to mandate more robust and uniform disclosures of environmental and emissions data in the coming years.
Over the long run, we anticipate environmental considerations could increase operating costs and the cost of capital for HY energy companies. As such, we believe HY energy companies that are ahead of their peers in adopting ESG-related best practices could ultimately have lower relative cost structures and superior financial performance. Additionally, we expect ESG-related headlines and considerations to provide for rich alpha generation opportunities for HY energy investors. On one side of the spectrum, opportunities could arise from market dislocations of bonds of certain HY energy companies for which the perception of ESG-related credit risk is overblown relative to reality. We also think there will be alpha opportunities in being early to identify ESG leaders or investing in companies that improve ESG-related metrics more rapidly than the market has discounted. Equally important, we believe that recognising ESG-related risks and avoiding those companies with the most exposure will also help mitigate downside risk where the market has not properly discounted those risks into bond valuations.
Understanding how ESG-related factors impact the risk-return profile of investment opportunities underscores the importance of active management in the HY market. We firmly believe the active approach to HY investing at Franklin Templeton—an approach that relies on exhaustive bottom-up fundamental research that fully incorporates ESG considerations—can put our clients in the best position to benefit from opportunities occurring in the ESG space.
OPEC+: Taking a Conservative Approach to Balancing the Global Oil Market
In early March 2020, as the likely considerable oil demand impact from COVID-19 came into focus, talks amongst the countries of OPEC and non-OPEC allies (together referred to as OPEC+) fell apart. In the wake of the collapse in talks, major producers within the OPEC+ group—especially Saudi Arabia and Russia—appeared to respond to demand weakness with an all-out market-share war, increasing production considerably as the oil market was on the precipice of an extraordinary negative demand shock. Following these actions, WTI oil fell from US$45.90 per barrel on 5 March to US$31.13 on 9 March.
Over the subsequent weeks, as the historic collapse in oil demand due to the pandemic became more apparent, oil prices cratered further into the US$20s. The downward pressure finally culminated with the infamous negative WTI closing of US($37.63) on 20 April 2020. As this sharp decline played out, OPEC+ quickly reversed course from the early March decision. On 12 April 2020, the group agreed on an initial headline 9.7 million barrels per day production cut (global pre-pandemic demand was about 100 million barrels per day). The 12 April agreement also outlined a plan to cut production to some extent through the end of April 2022.
In early December 2020, OPEC+ decided to start meeting on a monthly basis to assess market conditions and decide whether to release incremental supply to the market as was originally contemplated (but no more than 0.5 million barrels per day per month). With the continued restraint from OPEC+ and improving sentiment in risk markets following news of COVID-19 vaccines in November 2020, WTI crude oil ended 2020 at US$48.50 per barrel.
At the following OPEC+ meeting in early January 2021, OPEC leader Saudi Arabia took the market by surprise with the announcement of a voluntary additional 1 million barrel-per-day cut for February and March 2021. In early March, Saudi Arabia decided to extend its voluntary cut through the end of April and the rest of OPEC+ decided to continue March production levels through April (with the exception of a minor 0.15 million barrels per day combined production increase for non-OPEC members Russia and Kazakhstan). Finally, with the early April 2021 meeting, the group decided to bring back 1.15 million barrels per day of production gradually from May through July, while Saudi Arabia will also bring back its voluntary one million barrels back to the market over that same time frame.
Overall, despite an outlook for improving global demand for oil throughout 2021 as vaccinations roll out globally, OPEC+ has been relatively restrained in releasing barrels back into the market. This has contributed to a rise in the WTI crude oil benchmark price to over US$63 by mid-April 2020. Arguably, the discipline demonstrated by many public US shale oil producers to not invest in considerably increasing production in light of higher oil prices has given OPEC+ increased comfort in being able to push oil prices higher without ceding meaningful market share to the US shale oil industry.
2021 Starts off with a Bang for HY Energy
HY energy considerably outperformed the rest of the HY market in November and December 2020, with the ICE BofA HY Energy Index generating a +13.6% total return versus +4.9% for the HY ex-Energy and Metals & Mining Index.13 This strong momentum has carried into 2021, with the HY Energy Index generating 5.8% total return year to date versus a 1.3% total return for the HY ex-Energy and Metals & Mining index.14 One driver of the continued outperformance of HY energy is the move in WTI crude oil to the US$60s. Given the cost position and combined operating and financial leverage of the HY E&P universe, we think the recent move in oil prices from the high-US$40s to the US$60s should result in considerable improvement in future financial performance.
Given the recent HY energy outperformance, it is not surprising to see the steady flow of refinancing transactions from HY energy issuers. These refinancing transactions have incrementally improved the maturity profiles and liquidity position of some issuers, strengthening overall credit profiles and in some cases leading to upgrades or outlook changes from the credit ratings agencies.
The continued spread tightening of HY energy bonds now leaves the industry at an option-adjusted spread (OAS) of +428 as of April 19.15 While the spread pickup for HY Energy has tightened considerably, it still remains well outside of HY ex-Energy and Metals & Mining at +309.16 While the scope for relative spread tightening for HY has declined in recent months, we have continued to find a number of attractive opportunities in the industry that we think offer HY investors favorable risk/reward, particularly relative to the broader HY market.
Hopefully, 2020’s market storms are behind us.
Important Legal Information
This material is intended to be of general interest only and should not be construed as individual investment advice or a recommendation or solicitation to buy, sell or hold any security or to adopt any investment strategy. It does not constitute legal or tax advice.
The views expressed are those of the investment manager and the comments, opinions and analyses are rendered as of publication date and may change without notice. The information provided in this material is not intended as a complete analysis of every material fact regarding any country, region or market.
Data from third party sources may have been used in the preparation of this material and Franklin Templeton (“FT”) has not independently verified, validated or audited such data. FT accepts no liability whatsoever for any loss arising from use of this information and reliance upon the comments, opinions and analyses in the material is at the sole discretion of the user.
Products, services and information may not be available in all jurisdictions and are offered outside the U.S. by other FT affiliates and/or their distributors as local laws and regulation permits. Please consult your own financial professional or Franklin Templeton Institutional contact for further information on availability of products and services in your jurisdiction.
Issued in the U.S. by Franklin Templeton Distributors, Inc., One Franklin Parkway, San Mateo, California 94403-1906, (800) DIAL BEN/342-5236, franklintempleton.com—Franklin Templeton Distributors, Inc. is the principal distributor of Franklin Templeton’s’ U.S. registered products, which are not FDIC insured; may lose value; and are not bank guaranteed and are available only in jurisdictions where an offer or solicitation of such products is permitted under applicable laws and regulation.
CFA® and Chartered Financial Analyst® are trademarks owned by CFA Institute.
What Are the Risks?
All investments involve risks, including possible loss of principal. The value of investments can go down as well as up, and investors may not get back the full amount invested. Bond prices generally move in the opposite direction of interest rates. Investments in lower-rated bonds include higher risk of default and loss of principal. Thus, as prices of bonds in an investment portfolio adjust to a rise in interest rates, the value of the portfolio may decline. Changes in the credit rating of a bond, or in the credit rating or financial strength of a bond’s issuer, insurer or guarantor, may affect the bond’s value.
Investing in the natural resources sector involves special risks, including increased susceptibility to adverse economic and regulatory developments affecting the sector.
Actively managed strategies could experience losses if the investment manager’s judgment about markets, interest rates or the attractiveness, relative values, liquidity or potential appreciation of particular investments made for a portfolio, proves to be incorrect. There can be no guarantee that an investment manager’s investment techniques or decisions will produce the desired results.
Companies and/or case studies referenced herein are used solely for illustrative purposes; any investment may or may not be currently held by any portfolio advised by Franklin Templeton. The information provided is not a recommendation or individual investment advice for any particular security, strategy, or investment product and is not an indication of the trading intent of any Franklin Templeton managed portfolio.
________________
1. Sources: Bloomberg; ICE BofA (BAML) US HY Index and ICE BofA US High Yield Excluding Energy, Metals & Mining Index. Indices are unmanaged and one cannot directly invest in them. They do not include fees, expenses or sales charges. Past performance is not an indicator or a guarantee of future results. See franklintempletondatasources.com for additional data provider information.
2. One basis point is equal to 0.01%.
3. Sources: Bloomberg, ICE BofA High Yield Energy E&P Index, as at 20 April 2021. Indices are unmanaged and one cannot directly invest in them. They do not include fees, expenses or sales charges. Past performance is not an indicator or a guarantee of future results. See www.franklintempletondatasources.com for additional data provider information.
4. Sources: Bloomberg, ICE BofA BB HY Energy Index, ICE BofA HY Index, as at 20 April 2021. Indices are unmanaged and one cannot directly invest in them. They do not include fees, expenses or sales charges. Past performance is not an indicator or a guarantee of future results.
5. Sources: Bloomberg, ICE BofA BB HY Energy Index, ICE BofA HY Index, as at 31 December 2019. Indices are unmanaged and one cannot directly invest in them. They do not include fees, expenses or sales charges. Past performance is not an indicator or a guarantee of future results.
6. Sources: Bloomberg, ICE BofA BB HY Energy Index, as at 20 April 2021. Indice are unmanaged and one cannot directly invest in them. They do not include fees, expenses or sales charges. Past performance is not an indicator or a guarantee of future results.
7. Sources: Bloomberg, ICE BofA HY Index, as at 20 April 2021. Indices are unmanaged and one cannot directly invest in them. They do not include fees, expenses or sales charges. Past performance is not an indicator or a guarantee of future results.
8. Ibid.
9. Ibid.
10. Sources: Bloomberg, ICE BofA HY Energy Midstream/Distribution Index, as at 20 April 2021. Indices are unmanaged and one cannot directly invest in them. They do not include fees, expenses or sales charges. Past performance is not an indicator or a guarantee of future results.
11. Source: Antero Resources company presentation, February 2021.
12. Source: US EPA’s Inventory of US Greenhouse Gas Emissions and Sinks: 1990-2019.
13. Sources: Bloomberg; ICE BofA (BAML) US HY Index and ICE BofA US High Yield Excluding Energy, Metals & Mining Index. Indices are unmanaged and one cannot directly invest in them. They do not include fees, expenses or sales charges. Past performance is not an indicator or a guarantee of future results. Past performance is not an indicator or guarantee of future results. See www.franklintempletondatasources.com.
14. Sources: Bloomberg; ICE BofA (BAML) US HY Index and ICE BofA US High Yield Excluding Energy, Metals & Mining Index. Indices are unmanaged and one cannot directly invest in them. They do not include fees, expenses or sales charges. Past performance is not an indicator or a guarantee of future results. Past performance is not an indicator or guarantee of future results. Year-to-date returns through 18 April 2021.
15. Sources: Bloomberg, ICE BofA (BAML) US HY Index and ICE BofA US High Yield Excluding Energy, Metals & Mining Index. The option-adjusted spread (OAS) measures a fixed-income security’s rate of return versus the risk-free rate of return, typically represented by US Treasuries.
16. Ibid.