Last year was rough for the S&P 500 Index, with investors losing almost 18% in 2022 as market valuations de-rated. With investors looking for directional insights, we believe the focus will shift in 2023 toward earnings, which we believe have peaked as economic growth declines and restrictive policy conditions continue.
Key Points
- Earnings expectations have weakened this year; however, we still expect lower earnings per share (EPS) growth than consensus expectations.
- Profit margin changes are a key driver of earnings growth. We expect further margin weakness ahead.
- Our weak earnings outlook leads us to be defensively positioned in portfolios, with a preference for cash and fixed income over equities.
What story do earnings tell?
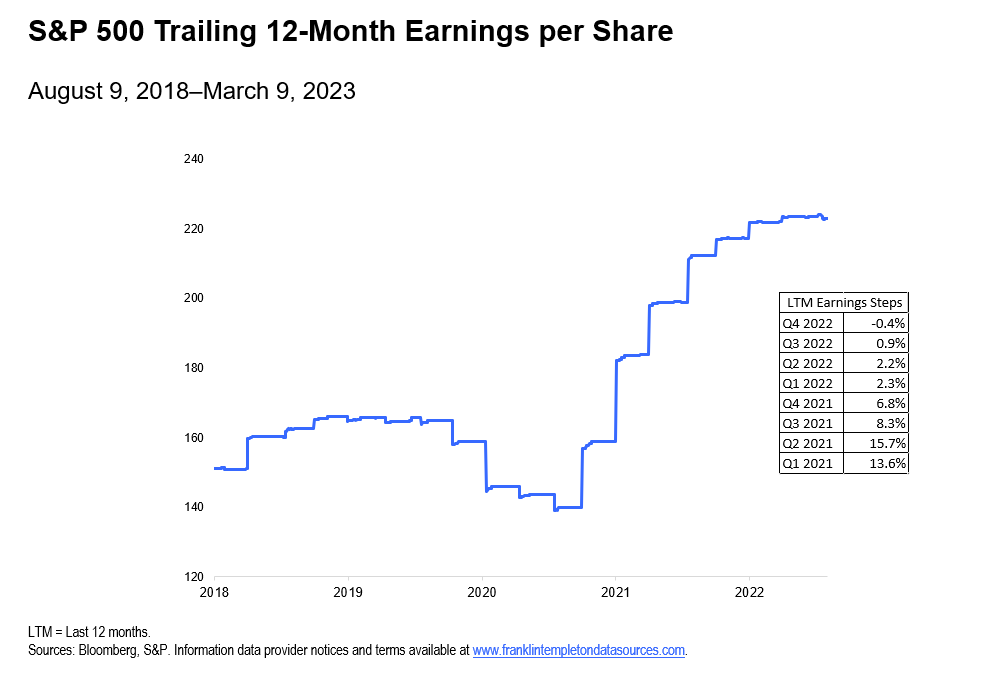
Following the COVID-19 pandemic, earnings of US companies improved for seven quarters.1 While consumer staples, health care and technology led the initial EPS recovery, it later shifted to cyclicals like industrials, materials and energy. These earnings improvements took the form of quarterly “steps” as earnings are reported quarterly (see Exhibit 1). With that said, something stands out to us that is concerning: As time has progressed, these “steps” have started to level off, meaning that the EPS growth rate has been declining. The most recent datapoint actually forms a “step-down,” representing a 40 basis-point decline in EPS growth.
Exhibit 1: Quarterly earnings—a stairway to…?
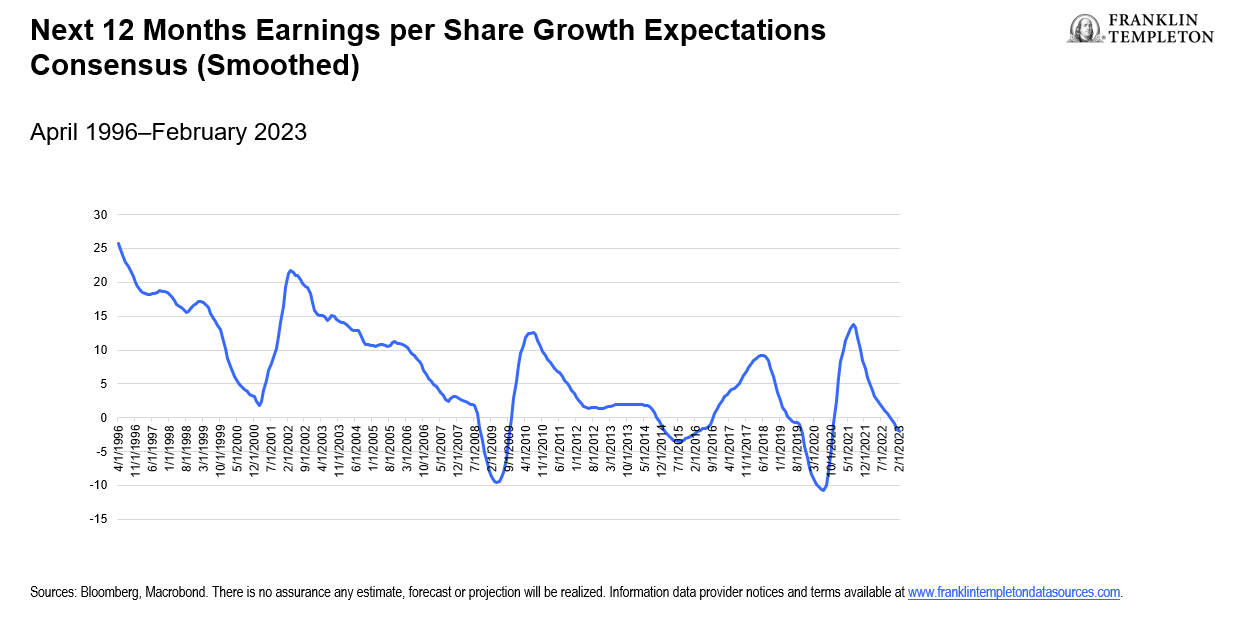
Since March 1991, the market consensus has expected positive earnings growth 74% of the time. Hence, an expected 2% EPS drop over the next 12 months is a notable signal. Weak consensus expectations have preceded historical bear markets, including the global financial crisis, the “earnings recession” of 2015/2016, and the onset of the COVID-19 pandemic (see Exhibit 2). Our leading EPS indicator, which uses leading economic and financial indicators to forecast EPS growth, suggests a 6% drop in EPS over the next year as both economic and financial indicators remain weak.2
Exhibit 2: Next 12-month earnings expectations have turned negative. What comes next?
The impact of profit margins on EPS
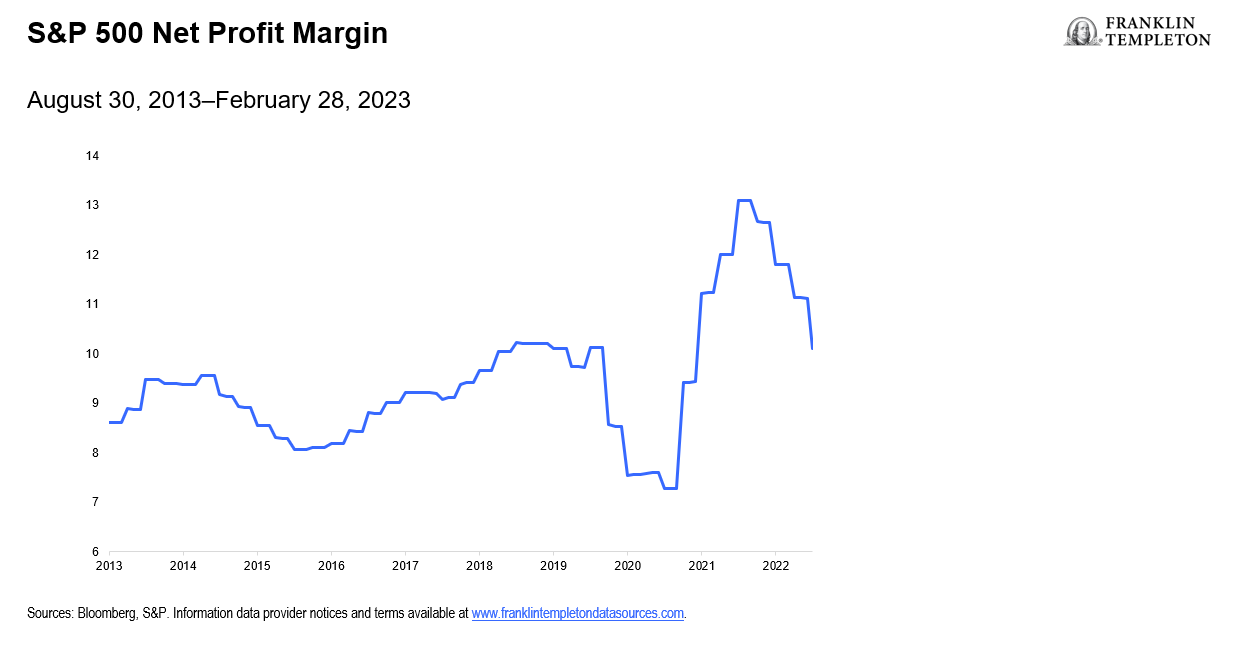
Profit margins are the culprit of the declining EPS story. By April 2022, companies were at a cyclical peak in profit margin levels, but they have since declined nearly 23%.3 Historically, profit margins have declined for extended periods of time—20 months on average—before troughing. We are about to hit the 12-month mark (see Exhibit 3). Can this trend reverse course? We think it’s unlikely to reverse course anytime soon. In the last seven periods of extended peak-to-trough margin declines (since 1990) EPS has declined during five of those seven periods at an average of -14%. Consensus expectations are currently -2%. Our weak macro forecast, leading EPS model, and analysis of previous profit margin cycles suggest to us that EPS growth will be lower than current expectations.
Exhibit 3: Companies have been unable to sustain the high profit margins of last year
Both demand and costs can drive a company’s profit margin. On the demand side, sales growth peaked a year ago alongside nominal US gross domestic product (GDP) growth. We think it will continue to slow alongside our forecasts for weaker GDP and inflation over the upcoming year. Nominal growth is particularly important for companies that have high operating leverage (a large amount of fixed costs relative to variable costs).
For company costs, a major reason why profit margins are declining is because a tight labor market has contributed to strong wage growth. The gap between job openings (nonfarm) and unemployed persons is the highest on record, as job demand remains far above historical levels. With labor participation still below pre-pandemic levels (62.5% today vs 63.3% pre-COVID) there continues to be a shortage of available workers.4 This has forced companies to raise wages to stay competitive in the labor market, but at the expense of profitability. Unit labor costs, which track employee compensation relative to business output, have risen to above 6% growth—far above the 2% average over the previous decade.5
The paradox of thrift—we need a growth catalyst
Can companies manage earnings by cutting costs? This introduces the paradox of thrift; while cost- cutting may have an immediate boost to corporate financial health, overall, more consumers will have less money in their pockets due to higher unemployment. Consequently, higher unemployment further weakens demand for goods and services, especially for the companies that provide them. Therefore, without a catalyst for growth, it is difficult to see the decline in profit margins abetting any time soon.
Unfortunately, the growth catalyst does not appear to be coming from the Federal Reserve (Fed). While the Fed has likely swung to a more data-dependent approach due to the unknown impact of the banking turmoil, core inflation remains well above its 2% target. We believe that reining in inflation is still the primary focus of the Federal Open Market Committee and will require the Fed to keep financial conditions tighter than what markets currently expect throughout 2023. For the Fed to bring down inflation, we think the most likely scenario is for the central bank to refrain from cutting rates this year. The continuation of tighter financial conditions will pressure most corporate bottom lines in the form of higher borrowing costs. No rate cuts this year will reinforce the lack of a growth catalyst while continuing to provide margin pressure.
Multi-asset implications
It is difficult to be bullish on risky assets given the earnings hurdle discussed above, particularly for US and developed market equities. This is especially true when cash and fixed income instruments are finally providing appealing yields. With yields having reset, we prefer cash and fixed income over equities. We believe bonds have decoupled from stocks, and going forward will once again serve as a defensive play during times of economic hardship and stock market weakness.
That being said, there are usually areas of opportunity to take on risk. An emerging macro theme of ours is a regional preference for the East versus West. Eastern economies, such as China and Japan, are expected to achieve trend-level growth with average core inflation. Western economies, such as the United States, Canada and Europe, should continue to exhibit below-trend growth with challenging inflation and policy backdrops. This leads us to be more constructive on Chinese equities as its economy reopens, and some parts of emerging market local currency debt.
WHAT ARE THE RISKS?
All investments involve risks, including the possible loss of principal. The value of investments can go down as well as up, and investors may not get back the full amount invested. The positioning of a specific portfolio may differ from the information presented herein due to various factors, including, but not limited to, allocations from the core portfolio and specific investment objectives, guidelines, strategy and restrictions of a portfolio.
Stock prices fluctuate, sometimes rapidly and dramatically, due to factors affecting individual companies, particular industries or sectors, or general market conditions.
Bond prices generally move in the opposite direction of interest rates. Thus, as prices of bonds in an investment portfolio adjust to a rise in interest rates, the value of the portfolio may decline. Investments in lower-rated bonds include higher risk of default and loss of principal. Changes in the credit rating of a bond, or in the credit rating or financial strength of a bond’s issuer, insurer or guarantor, may affect the bond’s value. In general, an investor is paid a higher yield to assume a greater degree of credit risk. The risks associated with higher-yielding, lower-rated debt securities include higher risk of default and loss of principal. Investments in foreign securities involve special risks including currency fluctuations, economic instability and political developments.
Investments in emerging markets, of which frontier markets are a subset, involve heightened risks related to the same factors, in addition to those associated with these markets’ smaller size, lesser liquidity and lack of established legal, political, business and social frameworks to support securities markets. To the extent a strategy focuses on particular countries, regions, industries, sectors or types of investment from time to time, it may be subject to greater risks of adverse developments in such areas of focus than a strategy that invests in a wider variety of countries, regions, industries, sectors or investments. China may be subject to considerable degrees of economic, political and social instability. Investments in securities of Chinese issuers involve risks that are specific to China, including certain legal, regulatory, political and economic risks.
IMPORTANT LEGAL INFORMATION
This material is intended to be of general interest only and should not be construed as individual investment advice or a recommendation or solicitation to buy, sell or hold any security or to adopt any investment strategy. It does not constitute legal or tax advice. This material may not be reproduced, distributed or published without prior written permission from Franklin Templeton.
The views expressed are those of the investment manager and the comments, opinions and analyses are rendered as at publication date and may change without notice. The underlying assumptions and these views are subject to change based on market and other conditions and may differ from other portfolio managers or of the firm as a whole. The information provided in this material is not intended as a complete analysis of every material fact regarding any country, region or market. There is no assurance that any prediction, projection or forecast on the economy, stock market, bond market or the economic trends of the markets will be realized. The value of investments and the income from them can go down as well as up and you may not get back the full amount that you invested. Past performance is not necessarily indicative nor a guarantee of future performance. All investments involve risks, including possible loss of principal.
Any research and analysis contained in this material has been procured by Franklin Templeton for its own purposes and may be acted upon in that connection and, as such, is provided to you incidentally. Data from third party sources may have been used in the preparation of this material and Franklin Templeton (“FT”) has not independently verified, validated or audited such data. Although information has been obtained from sources that Franklin Templeton believes to be reliable, no guarantee can be given as to its accuracy and such information may be incomplete or condensed and may be subject to change at any time without notice. The mention of any individual securities should neither constitute nor be construed as a recommendation to purchase, hold or sell any securities, and the information provided regarding such individual securities (if any) is not a sufficient basis upon which to make an investment decision. FT accepts no liability whatsoever for any loss arising from use of this information and reliance upon the comments, opinions and analyses in the material is at the sole discretion of the user.
Products, services and information may not be available in all jurisdictions and are offered outside the U.S. by other FT affiliates and/or their distributors as local laws and regulation permits. Please consult your own financial professional or Franklin Templeton institutional contact for further information on availability of products and services in your jurisdiction.
CFA® and Chartered Financial Analyst® are trademarks owned by CFA Institute.
_______________________
1. Measured as a year-over-year percentage change, using quarterly data.
2. There is no assurance that any estimate, forecast or projection will be realized.
3. Source: Bloomberg, S&P, as of February 28, 2023.
4. Source: Bureau of Labor Statistics, as of February 2023.
5. Source: Bureau of Labor Statistics, as of the fourth quarter of 2022.


