

Whether you’re still on the lookout for inflation head fakes or feeling more optimistic about a soft landing for the US economy, we think it’s a good time to re-evaluate portfolio allocations to the often-forgotten mid-capitalization (mid-cap) market segment.
More established and less risky than smaller-cap stocks, midcaps also tend to offer compelling growth potential for those seeking some balance at attractive valuations. Following this year’s rally in technology stocks, mid-cap stocks are now less expensive compared not only with tech-heavy, large-cap peers, but also small-cap firms.
Representing about 27% of the 1,000 largest US companies by market capitalization, the Russell Midcap Index trades at about 16.5 times projected earnings for 2023, compared to 20 times for the Russell 1000 and 23.6 times for its small-cap peer, the Russell 2000 Index.1
Allocation to the large-cap market, which has returned nearly 21% (for the Russell 1000 Index) year-to-date compared to a relatively modest 11% for the market’s midcap segment, understandably tempts investors.2 Though midcaps did slightly outperform larger caps for the month of November, investors may be hesitant to allocate to the segment, believing that a portfolio of large- and small-cap stocks provides adequate exposure across the market-cap spectrum. But it’s important to look at the longer-term potential of midcaps, which outperformed large caps (9.4% vs 8.3% annualized returns) in the 20-year period before the start of this year.3
Keep in mind that just a select few “magnificent” mega-cap tech stocks drove most larger-cap market gains. Mid-cap indexes, meanwhile, tend to be overweight in industrials—a sector that is arguably ramping up following recent US government stimulus initiatives that include the US$1 trillion Infrastructure and Jobs Act, clean energy spending related to the Inflation Reduction Act, and the CHIPS and Science Act, which is poised to strengthen American manufacturing, supply chains and an array of technologies.
Top industrial sector performers this year include a prominent trucking firm that operates in the more recession-resistant “less-than-truckload” transportation and logistics segment, as well as a leading broad supplier of maintenance, repair and operating products.
More compelling growth potential vs. large caps
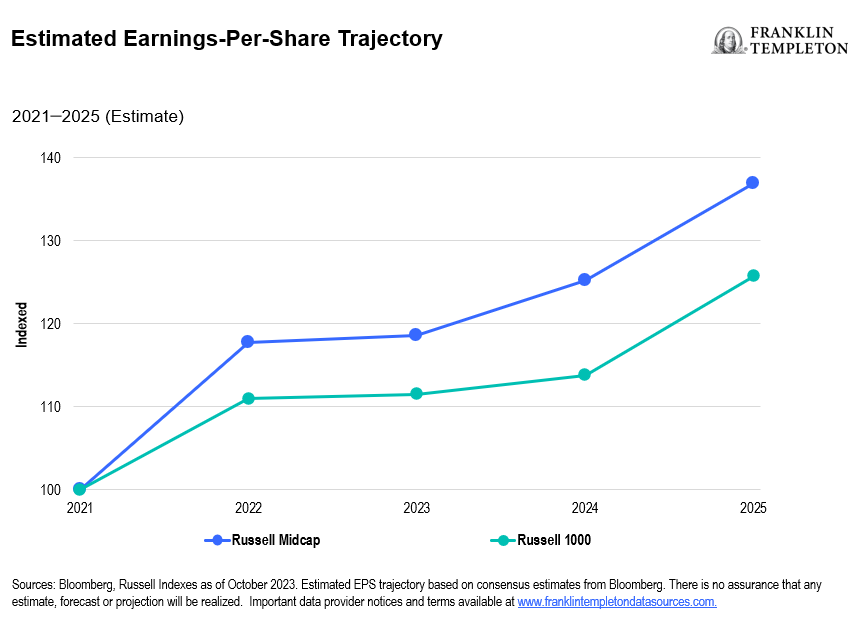
As a highlight to the greater potential of mid-cap companies for expanding market share and entering new markets, consider that Starbucks and Nvidia were solidly in the mid-cap segment 20 years ago, with market capitalizations of just under US$8 billion and US$1.2 billion, respectively. Known to be nimbler relative to larger companies, midcaps can quickly adapt to changing market conditions and capitalize on emerging opportunities. Our research shows that earnings estimates for mid-cap stocks are projected to grow faster than many large-cap companies that may have already reached their life cycle maturity.4
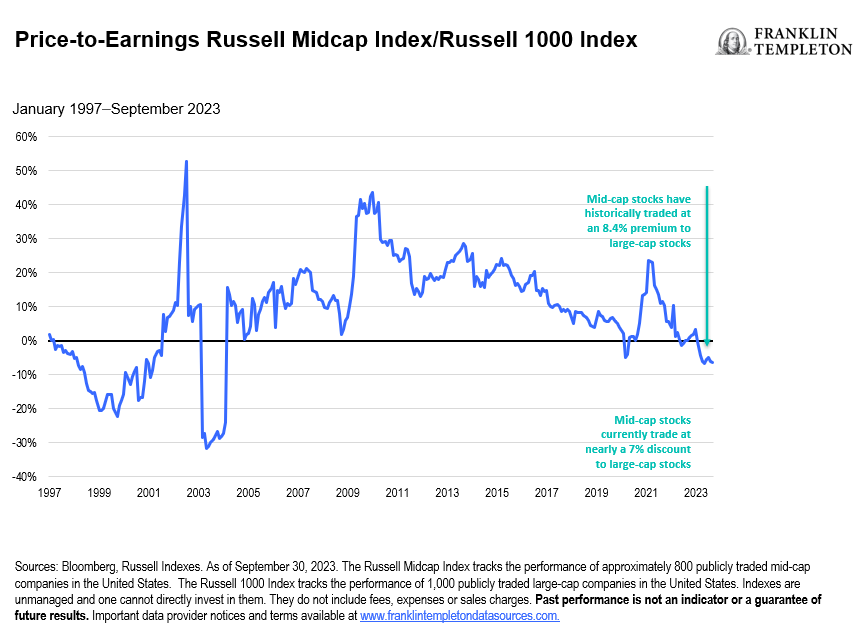
At the end of the third quarter, midcaps also had the benefit of being less expensive. Mid-cap stocks have historically traded at an 8.4% premium to large-cap stocks. But at the end of the third quarter, midcaps were trading a nearly a 7% discount to larger stocks.5
We believe the mid-cap universe offers compelling sector diversification and opportunities to participate in the upside of the broader market. What’s more, rules-based exchange-traded funds that are anchored around diversifying factors such as quality, value, momentum and low volatility can offer smoother performance for weathering market volatility.
The LibertyQ US Mid Cap Equity Index places a significant emphasis on security quality and value factors, while incorporating momentum and low volatility factors to a lesser extent for its top 25% of holdings. Year-to-date, quality has been the main driver of returns for the Index and its return on equity (ROE) was 90% higher than the Russell Midcap Index as of the end of October.6
And lastly, while midcap indices are less IT-heavy than larger-cap peers, multifactor tilts mean that they can still have meaningful weightings to the technology darlings of tomorrow.
WHAT ARE THE RISKS?
All investments involve risks, including possible loss of principal.
Equity securities are subject to price fluctuation and possible loss of principal.
Small- and mid-cap stocks involve greater risks and volatility than large-cap stocks. For actively managed ETFs, there is no guarantee that the manager’s investment decisions will produce the desired results.
ETFs trade like stocks, fluctuate in market value and may trade above or below the ETF’s net asset value. Brokerage commissions and ETF expenses will reduce returns. ETF shares may be bought or sold throughout the day at their market price on the exchange on which they are listed. However, there can be no guarantee that an active trading market for ETF shares will be developed or maintained or that their listing will continue or remain unchanged. While the shares of ETFs are tradable on secondary markets, they may not readily trade in all market conditions and may trade at significant discounts in periods of market stress.
Commissions, management fees, brokerage fees and expenses may be associated with investments in ETFs. Please read the prospectus and ETF facts before investing. ETFs are not guaranteed, their values change frequently, and past performance may not be repeated.
Any companies and/or case studies referenced herein are used solely for illustrative purposes; any investment may or may not be currently held by any portfolio advised by Franklin Templeton. The information provided is not a recommendation or individual investment advice for any particular security, strategy, or investment product and is not an indication of the trading intent of any Franklin Templeton managed portfolio.
IMPORTANT LEGAL INFORMATION
This material is intended to be of general interest only and should not be construed as individual investment advice or a recommendation or solicitation to buy, sell or hold any security or to adopt any investment strategy. It does not constitute legal or tax advice. This material may not be reproduced, distributed or published without prior written permission from Franklin Templeton.
The views expressed are those of the investment manager and the comments, opinions and analyses are rendered as at publication date and may change without notice. The underlying assumptions and these views are subject to change based on market and other conditions and may differ from other portfolio managers or of the firm as a whole. The information provided in this material is not intended as a complete analysis of every material fact regarding any country, region or market. There is no assurance that any prediction, projection or forecast on the economy, stock market, bond market or the economic trends of the markets will be realized. The value of investments and the income from them can go down as well as up and you may not get back the full amount that you invested. Past performance is not necessarily indicative nor a guarantee of future performance. All investments involve risks, including possible loss of principal.
Any research and analysis contained in this material has been procured by Franklin Templeton for its own purposes and may be acted upon in that connection and, as such, is provided to you incidentally. Data from third party sources may have been used in the preparation of this material and Franklin Templeton (“FT”) has not independently verified, validated or audited such data. Although information has been obtained from sources that Franklin Templeton believes to be reliable, no guarantee can be given as to its accuracy and such information may be incomplete or condensed and may be subject to change at any time without notice. The mention of any individual securities should neither constitute nor be construed as a recommendation to purchase, hold or sell any securities, and the information provided regarding such individual securities (if any) is not a sufficient basis upon which to make an investment decision. FT accepts no liability whatsoever for any loss arising from use of this information and reliance upon the comments, opinions and analyses in the material is at the sole discretion of the user.
Products, services and information may not be available in all jurisdictions and are offered outside the U.S. by other FT affiliates and/or their distributors as local laws and regulation permits. Please consult your own financial professional or Franklin Templeton institutional contact for further information on availability of products and services in your jurisdiction.
CFA® and Chartered Financial Analyst® are trademarks owned by CFA Institute.
_________
1. Bloomberg Nov. 14, 2023. Indexes are unmanaged and one cannot directly invest in them. They do not include fees, expenses or sales charges. There is no assurance that any estimate, forecast or projection will be realized.
2. Bloomberg Dec. 4, 2023. Indexes are unmanaged and one cannot directly invest in them. They do not include fees, expenses or sales charges. Past performance is not an indicator or a guarantee of future results.
3. Bloomberg Jan. 1, 2002 to Dec. 31, 2022 Russell Midcap Index, Russell 1000 Index. Indexes are unmanaged and one cannot directly invest in them. They do not include fees, expenses or sales charges. Past performance is not an indicator or a guarantee of future results.
4. There is no assurance that any estimate, forecast or projection will be realized.
5. Sources: Bloomberg, Russell Indices. As of the end of the third quarter, 2023.
6. Source: Morningstar. As of October 31, 2023. The LibertyQ US Mid Cap Equity Index is based on the Russell Midcap Index, its parent index, which measures the performance of the mid-cap segment of the US equity universe. The LibertyQ US Mid Cap Equity Index is designed to reflect the performance of a Franklin Templeton strategy that seeks exposure to four factors: Quality, Value, Momentum and Low Volatility. Indexes are unmanaged and one cannot directly invest in them. They do not include fees, expenses or sales charges. Past performance is not an indicator or a guarantee of future results.