

In his recent article “Quick Thoughts: Five surprises for 2024,” Head of Franklin Institute, Stephen Dover, opines that 2024 could mark the return of secular stagnation, where economic growth slows, inflation falls, and nominal rates revert to the lows present in the 2010s. If this assessment proves correct, real yields would be anticipated to return to a level below long-term real growth, where they resided from 2009-2022.
It is possible that this trend reversal has already begun. The yield on 10-year Treasury Inflation-Protected Securities (TIPS) fell significantly from ~2.5% to ~1.7% in the last two months of 2023.1 This is a notable correction, but real yields remain much higher than the ~0.5% average that prevailed after the European debt crisis in 2013 through the start of the pandemic in 2020.2
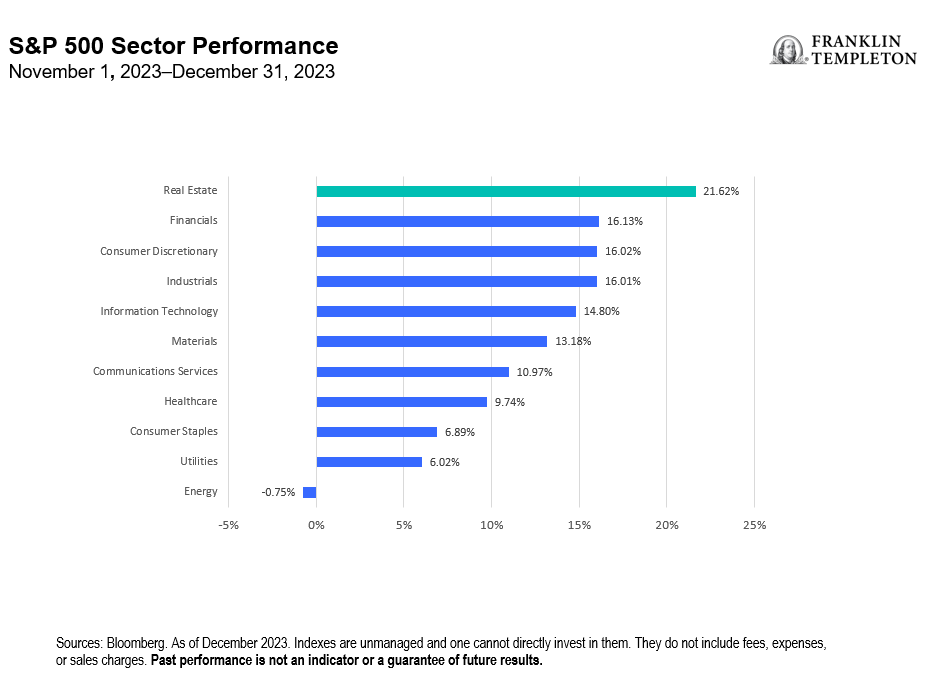
How does this affect real estate? As long-lived, fixed assets with inflation-protective characteristics, quality real estate can be viewed as an equivalent to TIPs plus a risk premium. This is seen empirically through the relationship between the average Adjusted Funds from Operations (AFFO) yield (the AFFO relative to the REIT share price) and a 10-year TIPS bond yield plus the BBB credit spread, as shown in Exhibit 1. As such, the recent return benefit of the rally in TIPS has extended to real estate. In fact, real estate was the best-performing sector in the S&P 500 Index from the peak in real yields at the end of October through the end of 2023 (See Exhibit 2). Notably, this phenomenon has not been US-specific; real estate was also the best-performing sector in Europe (as measured by the STXE 600 Index) from the peak in German real yields at the beginning of October through year-end.3
Exhibit 1: Average AFFO Yield and 10-Year TIPS Yield + BBB Credit Spread (right click on chart to enlarge)
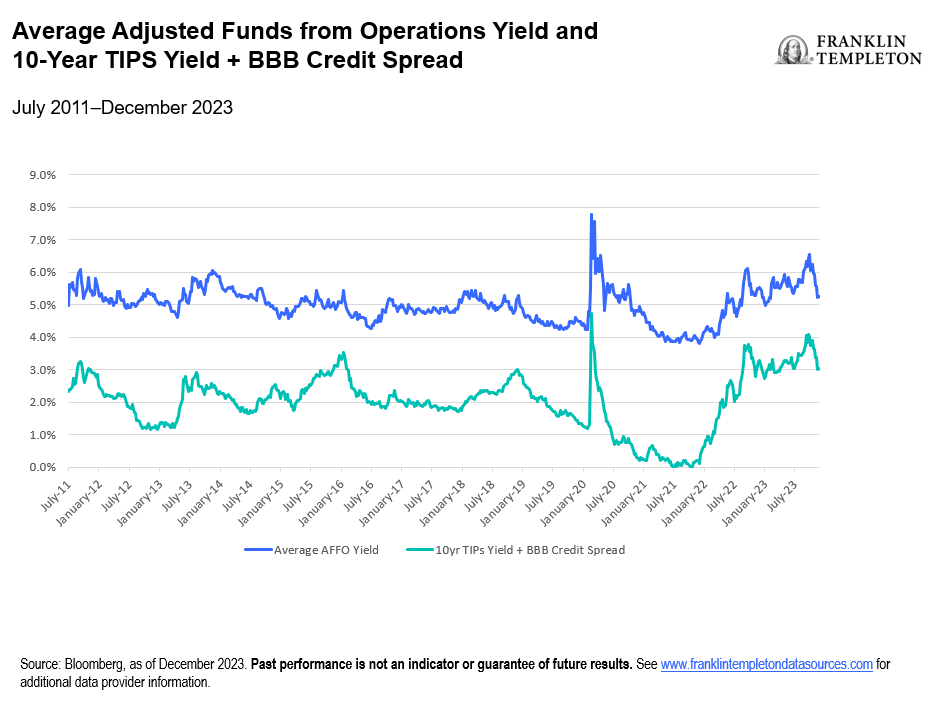
Exhibit 2: S&P 500 Sector Performance (right click on chart to enlarge)
Mean reversion is not guaranteed in financial markets, but it does have an enviable track record. Real estate was the worst-performing asset class in 2020 amid the pandemic and repeated the feat in 2022, as tightening monetary policy was discounted. By contrast, it was among the best-performing asset classes in 2021, as markets contemplated recovery from the worst of the COVID pandemic.4 This year could be poised to offer similar respite from the contagion of rising interest rates, which would make the recent retracement in Treasury yields a compelling entry point.
We understand warnings about systemic risk posed by commercial real estate—a valid concern for leveraged assets amid higher capital costs. We view this as a “wall of worry” to climb, particularly for publicly-traded real estate. As we discussed in our article in October, “REITs: Providing visibility in an age of uncertainty,” REITs have evolved since the global financial crisis; leverage is lower, and quality has improved. Moreover, the relevance of legacy assets with uncertain futures like offices and malls has diminished while technology-adjacent properties like towers, data centers and logistics have experienced robust secular growth. We also believe the cash flow outlook for the sector is resilient and that a forthcoming decline in new supply—a consequence of the tighter monetary policy that led to the downdraft in valuation—points toward accelerating rent growth as we approach 2025 and beyond.
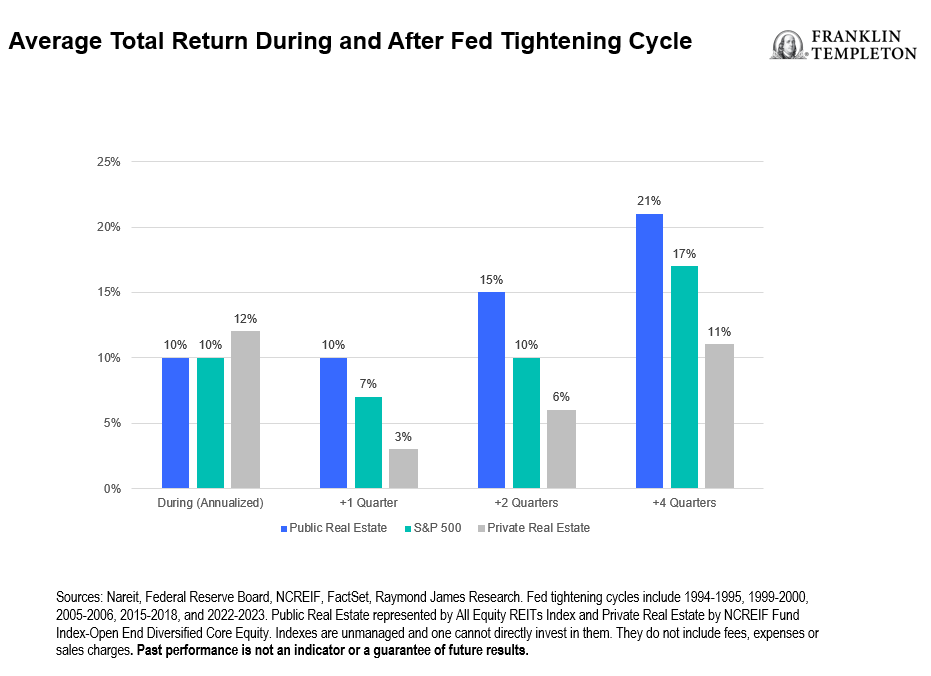
Finally, publicly traded real estate, as more dynamically valued assets, can thrive even if private real estate, which may not have been efficiently repriced to reflect the new cost of capital environment, remains challenged. As shown in Exhibit 3, REITs have historically outperformed equity averages and private real estate in particular following a Fed tightening cycle.
Exhibit 3: Average Total Return During and After Fed Tightening Cycle (right click on chart to enlarge)
As such, publicly traded real estate began to outperform once markets interpreted that the Fed was pivoting away from a tightening bias. If this does indeed signal the return of a dovish Fed and secular stagnation, we believe publicly traded real estate could positively surprise investors in 2024.
WHAT ARE THE RISKS?
All investments involve risks, including possible loss of principal. Equity securities are subject to price fluctuation and possible loss of principal. Fixed income securities involve interest rate, credit, inflation and reinvestment risks, and possible loss of principal. As interest rates rise, the value of fixed income securities falls.
Alternative strategies may be exposed to potentially significant fluctuations in value.
Real estate investment trusts (REITs) are closely linked to the performance of the real estate markets. REITs are subject to illiquidity, credit and interest-rate risks, and risks associated with small- and mid-cap investments.
Privately held companies present certain challenges and involve incremental risks as opposed to investments in public companies, such as dealing with the lack of available information about these companies as well as their general lack of liquidity.
Active management does not ensure gains or protect against market declines.
IMPORTANT LEGAL INFORMATION
This material is intended to be of general interest only and should not be construed as individual investment advice or a recommendation or solicitation to buy, sell or hold any security or to adopt any investment strategy. It does not constitute legal or tax advice. This material may not be reproduced, distributed or published without prior written permission from Franklin Templeton.
The views expressed are those of the investment manager and the comments, opinions and analyses are rendered as at publication date and may change without notice. The underlying assumptions and these views are subject to change based on market and other conditions and may differ from other portfolio managers or of the firm as a whole. The information provided in this material is not intended as a complete analysis of every material fact regarding any country, region or market. There is no assurance that any prediction, projection or forecast on the economy, stock market, bond market or the economic trends of the markets will be realized. The value of investments and the income from them can go down as well as up and you may not get back the full amount that you invested. Past performance is not necessarily indicative nor a guarantee of future performance. All investments involve risks, including possible loss of principal.
Any research and analysis contained in this material has been procured by Franklin Templeton for its own purposes and may be acted upon in that connection and, as such, is provided to you incidentally. Data from third party sources may have been used in the preparation of this material and Franklin Templeton (“FT”) has not independently verified, validated or audited such data. Although information has been obtained from sources that Franklin Templeton believes to be reliable, no guarantee can be given as to its accuracy and such information may be incomplete or condensed and may be subject to change at any time without notice. The mention of any individual securities should neither constitute nor be construed as a recommendation to purchase, hold or sell any securities, and the information provided regarding such individual securities (if any) is not a sufficient basis upon which to make an investment decision. FT accepts no liability whatsoever for any loss arising from use of this information and reliance upon the comments, opinions and analyses in the material is at the sole discretion of the user.
Products, services and information may not be available in all jurisdictions and are offered outside the U.S. by other FT affiliates and/or their distributors as local laws and regulation permits. Please consult your own financial professional or Franklin Templeton institutional contact for further information on availability of products and services in your jurisdiction.
CFA® and Chartered Financial Analyst® are trademarks owned by CFA Institute.
____________
1. Source: Federal Reserve Economic Data (FRED). As of December 31, 2023.
2. Ibid.
3. Source: Bloomberg, as of December 30, 2023. Indexes are unmanaged and one cannot directly invest in them. They do not include fees, expenses or sales charges. Past performance is not an indicator or a guarantee of future results.
4. Ibid.