
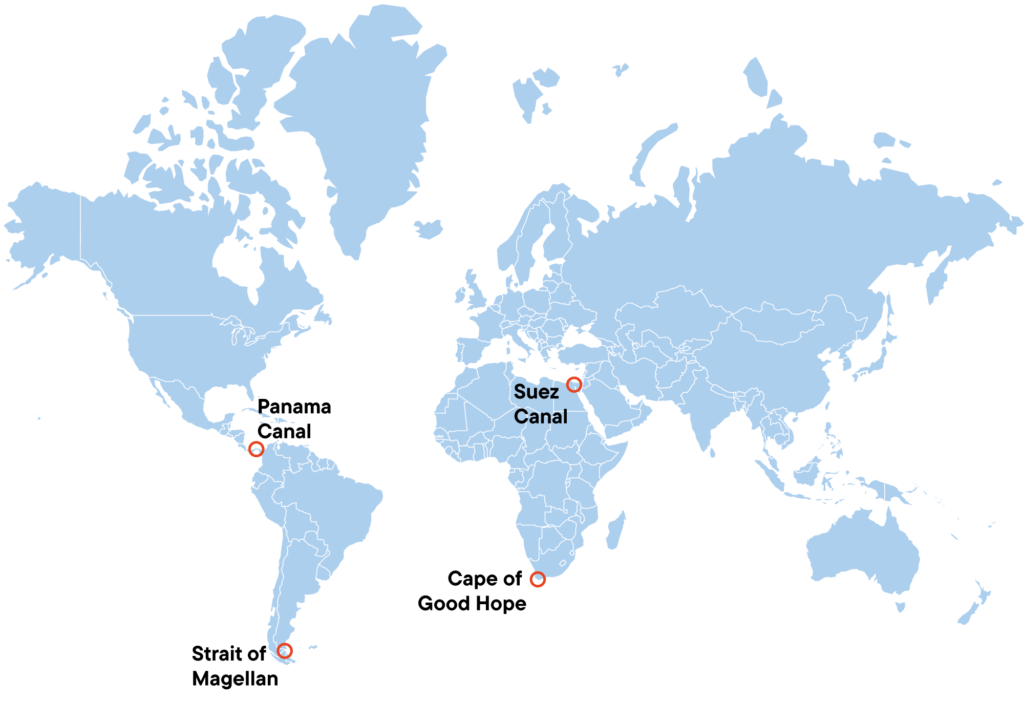
Major Shipping Lanes Around the World
International trade drives global economic growth, and around 80% of the global movement of goods is via maritime transport. Access to the two most important canals in the world has been fundamental to this growth. Today, they are chokepoints.
One is the Suez Canal, which the Suez Canal Company of France completed in 1869. It connects the Mediterranean Sea and the Red Sea, providing the fastest and cheapest route between Europe and Asia. Around 30% of global container traffic, 12%-15% of global trade, passes through this narrow stretch of water, estimated at over US$1 trillion of goods per year.1 That equates to 19,000 ships and revenues of US$9.4 billion in fiscal year 2023.2
In December 2023 and January 2024, the flow of traffic has been reduced by around 42%3 because of the Houthi militants’ missile and drone attacks on shipping, supported by Iran. The US and UK militaries are attacking Houthi missile installations in response, but so far without stopping the attacks. The route from Singapore to Rotterdam via Suez is 8,500 nautical miles and takes 26 days. Diverting to the route around the Cape of Good Hope is 11,800 miles and 36 days, adding US$1 million to the fuel costs of a round trip.4
We see indications that European importers are building inventory, effectively choosing “just in case” over “just in time.” Naturally, shipping rates have rocketed; the rates from Shanghai to Europe for example are up 256% since early December.5 Insurance premiums have also surged, adding to costs. The last time the canal was blocked in 2021, Lloyds List estimated that it was holding up US$9.6 billion6 worth of containerized traffic each day. Today, energy prices are clearly at risk, as 9.2 million barrels of oil and 4.1 billion cubic feet of liquified natural gas (LNG)7 flow through the canal each day.
The other is the Panama Canal. Built by the United States in 1914, it negotiates a 26-meter difference in water level between the Pacific and the Atlantic Oceans by way of inland lakes and locks. As a result, significant volumes of water are needed to get each vessel across the canal.
Here, the problem is climate change. We are seeing more frequent El Niño weather patterns,8 which result in drought, with a direct impact on the capacity of the canal. Normally it transits 12,000 vessels per year, carrying around 600 million metric tons of goods and earning US$4.97 billion in revenues. The number of ships is now down to 24 per day, a 27% decrease.9 The Panama Canal Authority (PCA) attributes the situation to higher temperatures in the Atlantic, compounded by El Niño and the delayed rainy season. The PCA forecasts the water level in the key Gatun Lake to fall 2% by April 2024, which will have a bearing on the tonnage of vessels that can use the canal, due to their draught.10
While Suez is intensive in commercial goods, food and oil shipments, Panama is the route for over 20% of global soybean exports, and over 15% of maize. It is also the main route for exports of US LNG to Asia.11 We have seen shipments diverted to Europe, replacing volumes from the Middle East, and even resulting in lower prices for the European Union.
For US soybean exporters, the Mississippi River is the immediate problem—barge flow restrictions have been more frequent because of lower water levels caused by drought. Close to 60% of US grain exports (wheat, soybeans, corn) travel this route by barge to get to the export terminals in the Gulf of Mexico. The winner here? Potentially Brazilian soybean farmers, who ship to China via the Atlantic route around the Cape of Good Hope. Midwestern farmers can use the railroads going west instead. Or use existing rail routes to Mexico and then divert to the Mexican Pacific ports.
It is too early to say if these bottlenecks will cause inflation. But it would be prudent to treat them as inflationary pressures that risk becoming structural. This is because of the wide variation in the cost increase by subsector, depending on the supply/demand balance in their destination markets and the extent to which longer sea routes impact the availability of empty vessels for the return journey.
Something to watch.
WHAT ARE THE RISKS?
All investments involve risks, including possible loss of principal.
Equity securities are subject to price fluctuation and possible loss of principal.
International investments are subject to special risks, including currency fluctuations and social, economic and political uncertainties, which could increase volatility. These risks are magnified in emerging markets. Investments in companies in a specific country or region may experience greater volatility than those that are more broadly diversified geographically.
Any companies and/or case studies referenced herein are used solely for illustrative purposes; any investment may or may not be currently held by any portfolio advised by Franklin Templeton. The information provided is not a recommendation or individual investment advice for any particular security, strategy, or investment product and is not an indication of the trading intent of any Franklin Templeton managed portfolio.
IMPORTANT LEGAL INFORMATION
This material is intended to be of general interest only and should not be construed as individual investment advice or a recommendation or solicitation to buy, sell or hold any security or to adopt any investment strategy. It does not constitute legal or tax advice. This material may not be reproduced, distributed or published without prior written permission from Franklin Templeton.
The views expressed are those of the investment manager and the comments, opinions and analyses are rendered as at publication date and may change without notice. The underlying assumptions and these views are subject to change based on market and other conditions and may differ from other portfolio managers or of the firm as a whole. The information provided in this material is not intended as a complete analysis of every material fact regarding any country, region or market. There is no assurance that any prediction, projection or forecast on the economy, stock market, bond market or the economic trends of the markets will be realized. The value of investments and the income from them can go down as well as up and you may not get back the full amount that you invested. Past performance is not necessarily indicative nor a guarantee of future performance. All investments involve risks, including possible loss of principal.
Any research and analysis contained in this material has been procured by Franklin Templeton for its own purposes and may be acted upon in that connection and, as such, is provided to you incidentally. Data from third party sources may have been used in the preparation of this material and Franklin Templeton (“FT”) has not independently verified, validated or audited such data. Although information has been obtained from sources that Franklin Templeton believes to be reliable, no guarantee can be given as to its accuracy and such information may be incomplete or condensed and may be subject to change at any time without notice. The mention of any individual securities should neither constitute nor be construed as a recommendation to purchase, hold or sell any securities, and the information provided regarding such individual securities (if any) is not a sufficient basis upon which to make an investment decision. FT accepts no liability whatsoever for any loss arising from use of this information and reliance upon the comments, opinions and analyses in the material is at the sole discretion of the user.
Products, services and information may not be available in all jurisdictions and are offered outside the U.S. by other FT affiliates and/or their distributors as local laws and regulation permits. Please consult your own financial professional or Franklin Templeton institutional contact for further information on availability of products and services in your jurisdiction.
______________________________________
1. Source: “Shippers remain wary of Red Sea transit as regional tensions rise.” S&P Global Commodity Insights. January 2, 2024.
2. Source: “Suez Canal annual revenue hits $9.4 billion, chairman says.” Reuters. June 21, 2023.
3. Source: “Red Sea, Black Sea and Panama Canal: UNCTAD raises alarm on global trade disruptions.” United Nations Conference on Trade and Development (UNCTAD), January 26, 2024.
4. Source: “Shippers remain wary of Red Sea transit as regional tensions rise.” S&P Global Commodity Insights. January 2, 2024.
5. Source: “Red Sea, Black Sea and Panama Canal: UNCTAD raises alarm on global trade disruptions.” United Nations Conference on Trade and Development (UNCTAD). January 26, 2024.
6. Source: “Suez Canal remains blocked despite efforts to refloat grounded Ever Given.” Lloyds’ List. March 24, 2021.
7. Source: “Red Sea chokepoints are critical for international oil and natural gas flows.” EIA. December 4, 2023.
8. Source: “Has climate change already affected ENSO?” National Oceanic and Atmospheric Administration (NOAA). July 27, 2023.
9. Source: Panama Canal Authority (PCA). December 15, 2023. “The Panama Canal to increase daily transits to 24 starting in January.”
10. The draft or draught of a ship is the vertical distance between the waterline and the bottom of the hull, or keel. It includes rudders, propellers etc.
11. Source: “Principal; Commodities shipped through the Panama Canal.” Panama Canal Authority (PCA), Statistics. Accessed February 9, 2024.