

In this “On My Mind,” I want to focus on the US fiscal outlook, its relationship to inflation, and the implications for interest rates and bond yields. Let’s start with a snapshot of the US federal government’s fiscal deficit for the past three decades.
Exhibit 1: US Fiscal Deficit—Percent of GDP
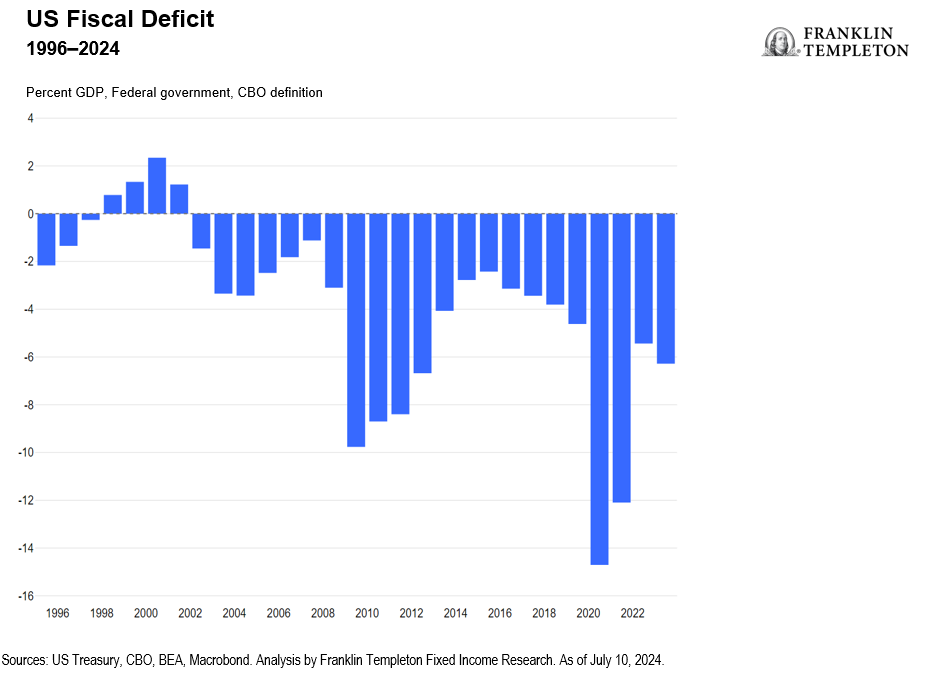
For the first half of this period, fiscal policy looked fairly prudent, and the deficit averaged slightly more than 1% of gross domestic product (GDP). Then, with the global financial crisis (GFC), we entered a completely new era: an era of recurrent emergencies and much looser fiscal policy, during which the annual deficit averaged 6.5%. (See Exhibit 1.)
The GFC triggered a massive and much-needed stimulus response, and fiscal policy stayed loose as the economy struggled to recover; during 2009-2012 the deficit averaged 8.4% of GDP. (See Exhibit 1.) The fiscal stance then tightened, and the deficit averaged 3.5% between 2013 and 2019—a more reasonable stance, though still considerably looser than prior to the GFC. The COVID-19 lockdowns were met with another massive fiscal response, as government spending compensated for the forced stoppage of the private economy, and the deficit ballooned to nearly 15% in 2020. While this immediate response was necessary, the extremely loose fiscal stance over 2021-2023 seems much harder to justify. In 2021, even as the economy bounced back strongly as soon as the lockdowns were lifted, the fiscal deficit still ran at over 12%. With GDP continuing to expand at a brisk pace, the deficit averaged a shocking 8% of GDP during 2021-2023. The massive 2021 fiscal boost to an already-rebounding economy was a major contributor to the sudden acceleration in inflation, and the persistent large deficits made the subsequent disinflation effort that much harder.
Fueled by larger deficits, debt held by the public has doubled as a percentage of GDP, from under 50% in 1995 to nearly 100% in 2023. For a while, rising debt levels seemed harmless. As you can see in Exhibit 2, net interest outlays fell significantly from an average of about 3% of GDP in the 1990s to about 1.5% by the time of the GFC, and they remained at this lower level even as debt climbed higher and higher.
Zero-interest-rate policy and quantitative easing helped keep government borrowing costs extremely low. This was the time when most economists and institutions like the International Monetary Fund actively exhorted governments to borrow more and invest, since borrowing seemed almost free. This advice was, in principle, not totally misguided; borrowing at low rates to invest in growth-boosting measures (such as infrastructure) could have raised long-term potential growth and truly paid for itself. But when policymakers no longer have a budget constraint, they are unlikely to spend wisely. So, deficits and debt increased, but potential growth did not.
Exhibit 2: Debt Held by the Public and Net Interest Outlays
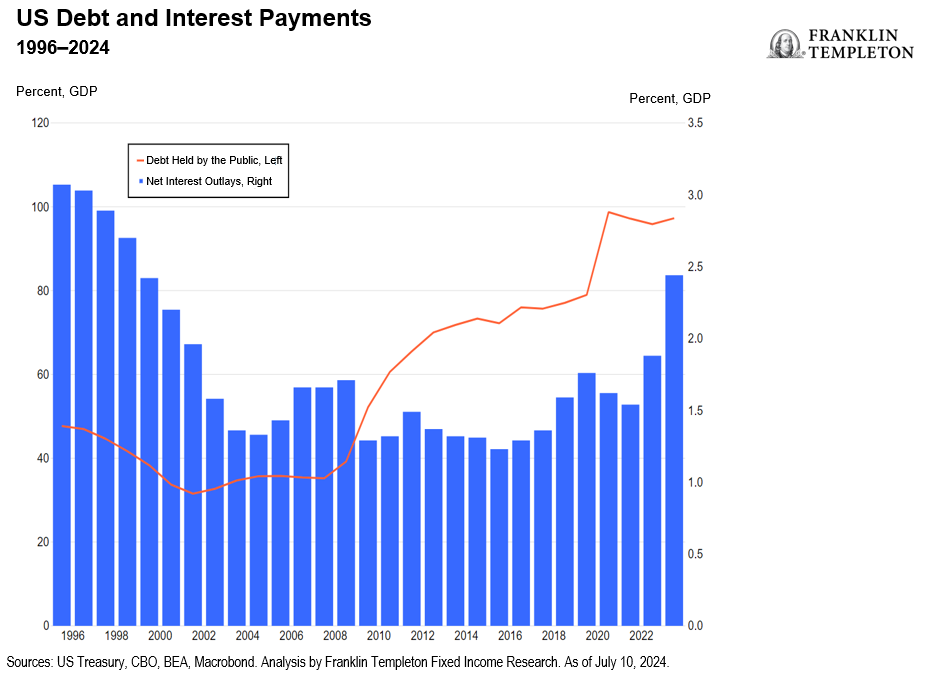
Contrary to what some economists and most governments believed, the era of free money did not last forever. Interest rates have risen back toward their historical norm, and the government interest bill has increased to over 2.5% of GDP last year and is projected to exceed 3% this year.1
Things could have been even worse (and they will be, as I will argue later). Take a look at Exhibit 3.
Exhibit 3: US Fiscal Deficit and Public Debt
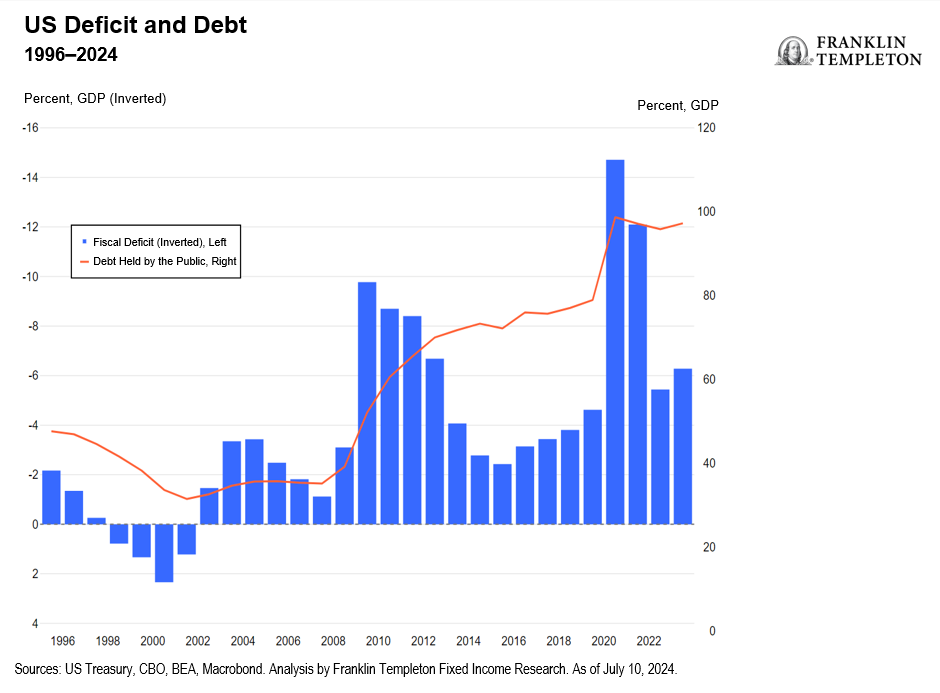
Larger fiscal deficits, as I mentioned earlier, drive debt higher. But notice this: Between 2009 and 2012, in response to the GFC, the government ran a cumulated budget deficit of over 33% of GDP. Over the same period, the debt ratio rose by a commensurate 30% of GDP. Then over the past three years, the government ran a cumulated deficit of 24% of GDP, and yet, the debt-to-GDP ratio actually fell by one percentage point. (See Exhibit 4.) In terms of impact on the debt ratio, it’s as if all the borrowing of the past three years never happened.
How is that possible? Well, it turns out that even though inflation can be a serious political liability for a government, it does have some compensating benefits. Inflation taxes money away from creditors to the advantage of debtors. The very high inflation of the past three years boosted nominal GDP growth, keeping the debt-to-GDP ratio under control.
Exhibit 4: Nominal GDP and Debt Held by the Public
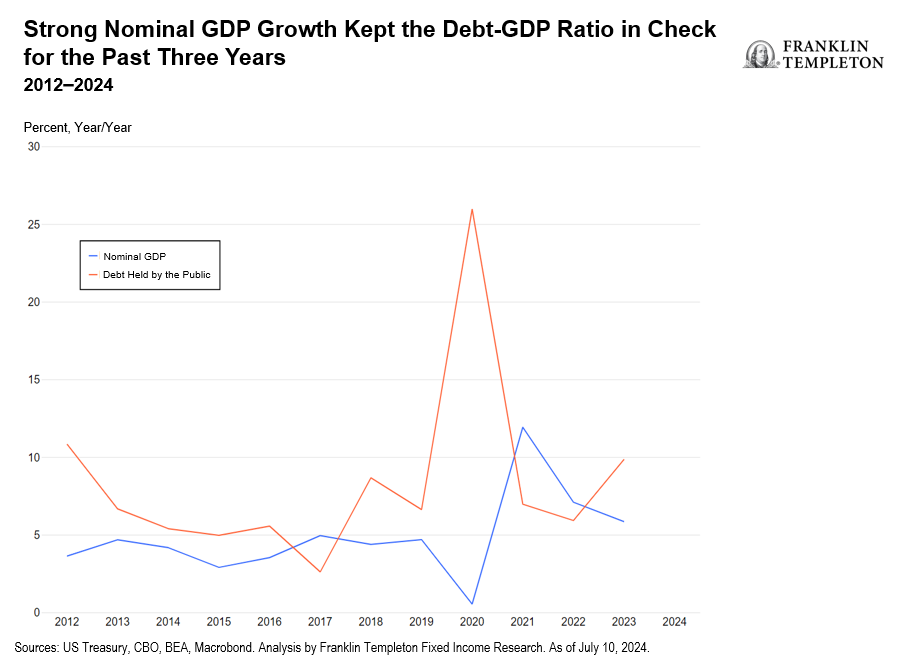
Now that inflation is coming back under control, however, maintaining such strong nominal GDP growth becomes essentially impossible. Over the past three years, nominal GDP expanded on average by about 9% per year. This resulted from real GDP growth averaging a bit over 3% per year (thanks notably to the strong 2021 rebound), and inflation averaging a bit under 6% per year.2 Once inflation drops from 6% to the 2% target, in order to have the same 9% growth in nominal GDP growth, we would need real GDP growth to average about 7% per year. This appears wildly implausible, given that potential real GDP growth is estimated at around 2%. With much lower nominal GDP growth, large fiscal deficits would again translate into rising debt levels.
On current trends and policies, fiscal deficits are indeed likely to remain large. Exhibit 5 outlines the latest long-term Congressional Budget Office (CBO) projections.
Exhibit 5: CBO Fiscal Deficit Projections
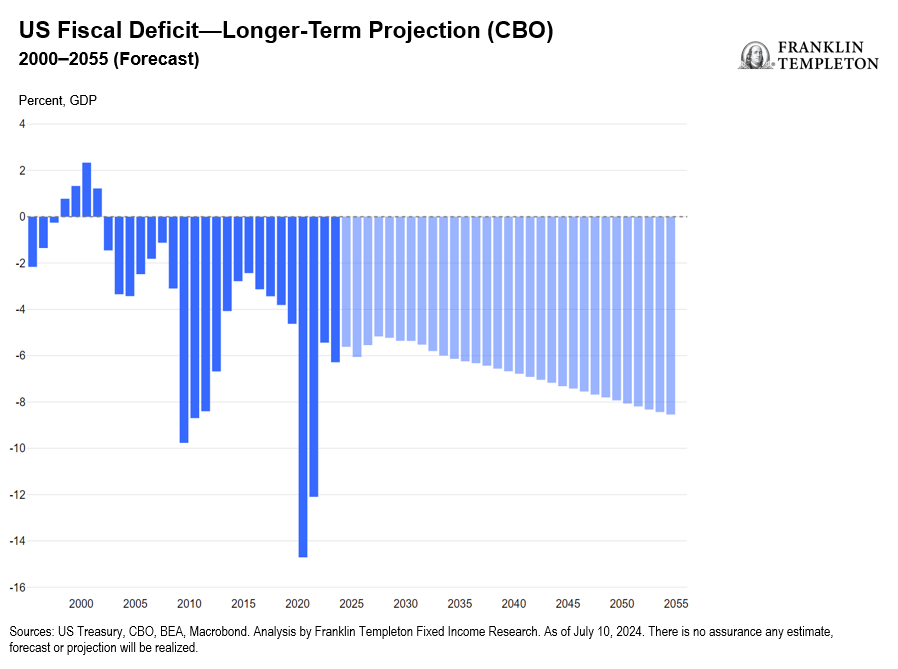
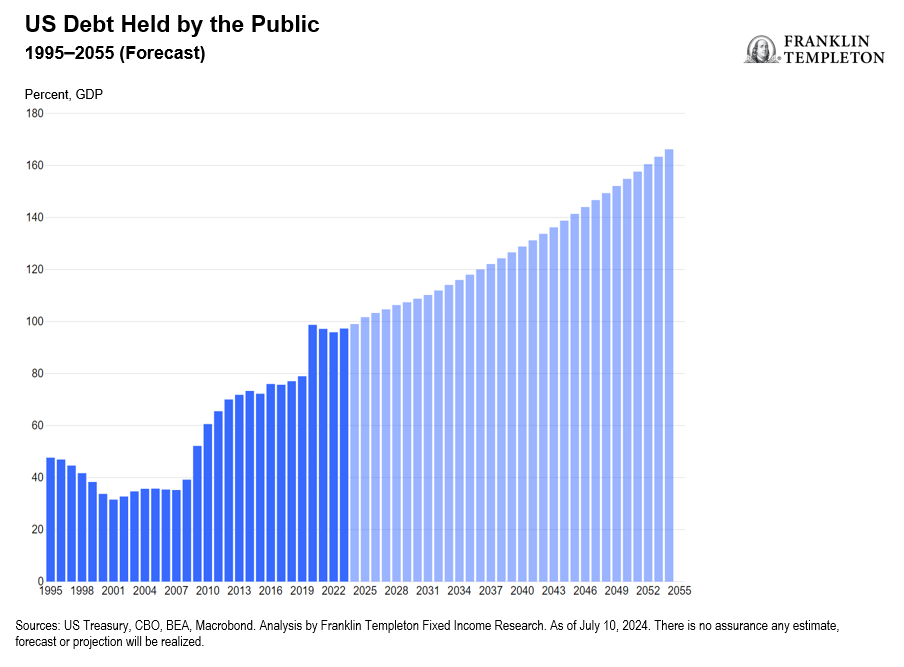
The near future looks as bad as the recent past, with deficits averaging 5.5% of GDP through the end of the decade. This is despite the CBO’s optimistic assumption that the interest rate on federal debt will barely exceed 3.5% over the next decade. If the average interest rate on the debt turns out to be higher, as I believe is more likely, net interest spending will be higher and the deficit even larger than the CBO projects. Looking farther out, things get even worse, with deficits heading to 8% of GDP. In this scenario, the debt ratio would rapidly increase, as the CBO projections show.
Exhibit 6: Forecasted US Public Debt, as a Percent of GDP
I do not expect this to happen. As economist Herbert Stein said, “If something cannot go on forever, it will stop.” Something will have to give, and a future administration at some point will have to course-correct with expenditure cuts and/or tax hikes. It will be tough—net interest expenses are expected to exceed non-defense discretionary expenditure as early as 2025, accounting for 3.25% of nominal GDP (the highest since 1991) and roughly 16% of non-defense spending.3 With non-defense discretionary expenditures already low, and any defense cuts constrained by a dangerous geopolitical environment, Congress will likely have to compromise on a painful mix of entitlement reforms (spending cuts to health care and/or social security) and tax increases.
Congressional action in this direction is unlikely to happen in the near term, however. The policy intentions unveiled so far by both parties point to continued large deficits through the next term, though in somewhat different forms. With a Republican victory, taxes would likely remain at current levels and there would be little action on expenditures; with a Democratic victory, taxes would likely go up, but expenditures would rise further. (Much will depend on the combination of White House, House and Senate outcomes.)
As far the government debt servicing burden is concerned, the coming years look a lot more challenging than the past decade and a half. The government will no longer have the benefit of ultra-low interest rates on its borrowing, and it will no longer be able to rely on high inflation keeping real debt stable in the face of continued large deficits.
The prospect of persistently loose fiscal policy strengthens my conviction that the coming Federal Reserve easing cycle will be gradual and shallow—I expect a total of 125-150 basis points in easing, barring any unexpected shocks. This would leave fed funds rate around 4%, and with this kind of floor on short term rates, I continue to expect that in the medium to long term, 10-year US Treasury yields should settle north of 5%.
WHAT ARE THE RISKS?
All investments involve risks, including possible loss of principal.
Fixed income securities involve interest rate, credit, inflation and reinvestment risks, and possible loss of principal. As interest rates rise, the value of fixed income securities falls. Low-rated, high-yield bonds are subject to greater price volatility, illiquidity and possibility of default.
IMPORTANT LEGAL INFORMATION
This material is intended to be of general interest only and should not be construed as individual investment advice or a recommendation or solicitation to buy, sell or hold any security or to adopt any investment strategy. It does not constitute legal or tax advice. This material may not be reproduced, distributed or published without prior written permission from Franklin Templeton.
The views expressed are those of the investment manager and the comments, opinions and analyses are rendered as at publication date and may change without notice. The underlying assumptions and these views are subject to change based on market and other conditions and may differ from other portfolio managers or of the firm as a whole. The information provided in this material is not intended as a complete analysis of every material fact regarding any country, region or market. There is no assurance that any prediction, projection or forecast on the economy, stock market, bond market or the economic trends of the markets will be realized. The value of investments and the income from them can go down as well as up and you may not get back the full amount that you invested. Past performance is not necessarily indicative nor a guarantee of future performance. All investments involve risks, including possible loss of principal.
Any research and analysis contained in this material has been procured by Franklin Templeton for its own purposes and may be acted upon in that connection and, as such, is provided to you incidentally. Data from third party sources may have been used in the preparation of this material and Franklin Templeton (“FT”) has not independently verified, validated or audited such data. Although information has been obtained from sources that Franklin Templeton believes to be reliable, no guarantee can be given as to its accuracy and such information may be incomplete or condensed and may be subject to change at any time without notice. The mention of any individual securities should neither constitute nor be construed as a recommendation to purchase, hold or sell any securities, and the information provided regarding such individual securities (if any) is not a sufficient basis upon which to make an investment decision. FT accepts no liability whatsoever for any loss arising from use of this information and reliance upon the comments, opinions and analyses in the material is at the sole discretion of the user.
Products, services and information may not be available in all jurisdictions and are offered outside the U.S. by other FT affiliates and/or their distributors as local laws and regulation permits. Please consult your own financial professional or Franklin Templeton institutional contact for further information on availability of products and services in your jurisdiction.
CFA® and Chartered Financial Analyst® are trademarks owned by CFA Institute.
_____________________________________
1. Source: Congressional Budget Office, As of June 18, 2024. There is no assurance any estimate, forecast or projection will be realized.
2. Source: US Bureau of Economic Analysis. As of June 27, 2024.
3. There is no assurance that any estimate, forecast or projection will be realized.