

The market backdrop
As equities continue to march higher, market concentration has been the source of investor anxiety. This follows a first half of the year in which just two sectors (information technology and communication services) outperformed the market-cap weighted S&P 500, while the Index returned over 15%.1 This unusual market backdrop has been driven by the soaring performance and profitability of the Magnificent Seven2—about 2/3 of the S&P 500’s first-half returns are due solely to this group.
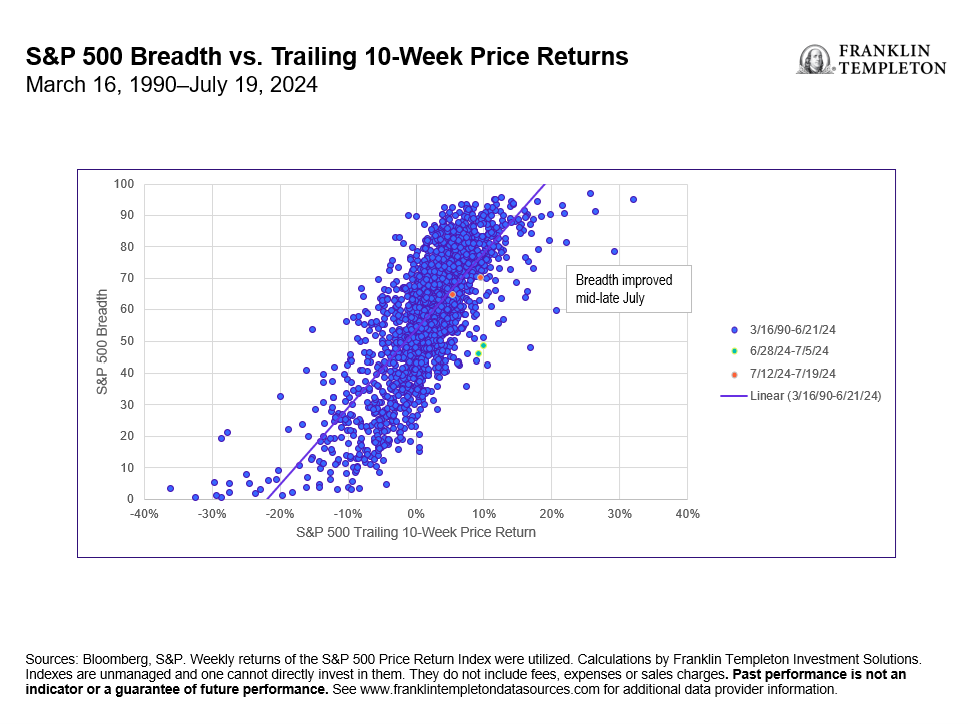
As depicted in Exhibit 1 below, there is typically a positive correlation between market breadth and returns, although this has been challenged as relatively low breadth has characterized the most recent market rally from mid-June to early July. Lately, breadth has improved dramatically as another weak US inflation print and dovish Fedspeak caused a strong internal equity rotation. For instance, small cap stocks outperformed the S&P 500 by 10.9% over the trailing two-week period (as of July 23, 2024), the highest two-week outperformance since December 1978.3
Exhibit 1: Market Breadth Sees a Return to Normal in Mid-July
Asset allocation strategy considerations
Although trailing performance and breadth measures have normalized, a few important questions arise: first, is the equity-market concentration a signal to de-risk portfolios? We find little evidence that heightened equity-market concentration is associated with weaker future market returns. There have been a handful of corollaries over the last 60 years in which bull markets have likewise been led by a handful of names (recently in 2011, 2015, 2020 and 2023). On average, returns in the year following have been little changed from long-run average equity returns.
Likewise, average, or even outright weak, S&P 500 breadth hasn’t historically portended subsequent weak returns, so long as equity momentum remains positive. We have also recently seen breadth improving across the US equity market—over the last few weeks, the percentage of S&P 500 constituents trading above the 50-day moving average has spiked from 47% on July 8, 2024, to 70% on July 22, 2024. Historically, strong upticks in market breadth have shown to be positive catalysts for equity outperformance.
Another important question that has arisen is whether this an opportune time to rotate out of this year’s leaders and into its laggards. Given our constructive macro view, we believe that there is room for some of the first half’s laggards to post better performance over the next six months. Macroeconomic growth remains at trend and we see little risk of recession in the near term. This setting is also accompanied by a normalization in inflation and policy, which should help insulate the economy. For a year-to-date laggard like the small-cap segment, high interest rates have been a problem given their debt exposure dynamics—namely, lower credit quality and higher exposure to floating/short-term fixed rate financing. In our analysis, the interest-rate outlook is more constructive, for now, which has acted as a tailwind over the last week.
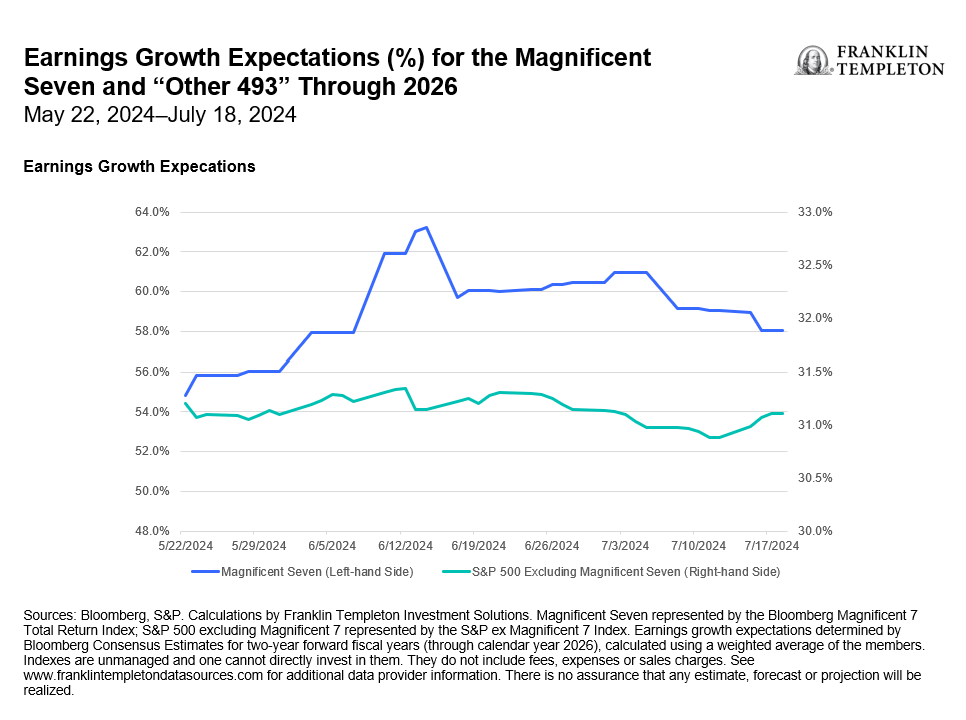
Conversely, we believe it has been nothing short of a fool’s errand to try to call a peak for the Magnificent Seven. There are good reasons for their resilience—many of the business models have high barriers to entry. Booming sales growth and/or profits aren’t leading to new market entrants competing away profits. However, one area that is catching our attention is the rising earnings expectations relative to the rest of the market. As evidenced by Exhibit 2 below, investors continue to price in a hefty return on investment for their artificial intelligence (AI)-related capital expenditures. Two years from now, investors expect 60% earnings growth from the Magnificent Seven vs. 31% growth from the rest of the market. It remains to be seen whether these lofty expectations are attainable.
Exhibit 2: Expectations Are High for the Magnificent Seven
Putting it all together
The market setup in the first half of the year was unique given a high index concentration, all-time-high stock prices and weakening breadth. Importantly, breadth has surged recently and is now in-line with equity-market performance. In our opinion, the market backdrop is no longer “out of whack.”
We do not view the current setup as a time to get more defensive. We find limited evidence that market concentration is a bearish signal. Instead, we see greater evidence that improving breadth and strong price momentum suggests portfolios should not become too defensive. Our outlook remains neutral.
Some of this year’s laggards, such as small caps, have a positive skew given that the growth environment remains firm and inflation and interest rates are declining. We hold a neutral view toward this year’s leaders, such as the Magnificent Seven, while acknowledging the risk of high earnings expectations for the group and the market more broadly.
WHAT ARE THE RISKS?
All investments involve risks, including possible loss of principal.
Equity securities are subject to price fluctuation and possible loss of principal.
Fixed income securities involve interest rate, credit, inflation and reinvestment risks, and possible loss of principal. As interest rates rise, the value of fixed income securities falls.
Any companies and/or case studies referenced herein are used solely for illustrative purposes; any investment may or may not be currently held by any portfolio advised by Franklin Templeton. The information provided is not a recommendation or individual investment advice for any particular security, strategy, or investment product and is not an indication of the trading intent of any Franklin Templeton managed portfolio.
IMPORTANT LEGAL INFORMATION
This material is intended to be of general interest only and should not be construed as individual investment advice or a recommendation or solicitation to buy, sell or hold any security or to adopt any investment strategy. It does not constitute legal or tax advice. This material may not be reproduced, distributed or published without prior written permission from Franklin Templeton.
The views expressed are those of the investment manager and the comments, opinions and analyses are rendered as at publication date and may change without notice. The underlying assumptions and these views are subject to change based on market and other conditions and may differ from other portfolio managers or of the firm as a whole. The information provided in this material is not intended as a complete analysis of every material fact regarding any country, region or market. There is no assurance that any prediction, projection or forecast on the economy, stock market, bond market or the economic trends of the markets will be realized. The value of investments and the income from them can go down as well as up and you may not get back the full amount that you invested. Past performance is not necessarily indicative nor a guarantee of future performance. All investments involve risks, including possible loss of principal.
Any research and analysis contained in this material has been procured by Franklin Templeton for its own purposes and may be acted upon in that connection and, as such, is provided to you incidentally. Data from third party sources may have been used in the preparation of this material and Franklin Templeton (“FT”) has not independently verified, validated or audited such data. Although information has been obtained from sources that Franklin Templeton believes to be reliable, no guarantee can be given as to its accuracy and such information may be incomplete or condensed and may be subject to change at any time without notice. The mention of any individual securities should neither constitute nor be construed as a recommendation to purchase, hold or sell any securities, and the information provided regarding such individual securities (if any) is not a sufficient basis upon which to make an investment decision. FT accepts no liability whatsoever for any loss arising from use of this information and reliance upon the comments, opinions and analyses in the material is at the sole discretion of the user.
Products, services and information may not be available in all jurisdictions and are offered outside the U.S. by other FT affiliates and/or their distributors as local laws and regulation permits. Please consult your own financial professional or Franklin Templeton institutional contact for further information on availability of products and services in your jurisdiction.
Brazil: Issued by Franklin Templeton Investimentos (Brasil) Ltda., authorized to render investment management services by CVM per Declaratory Act n. 6.534, issued on October 1, 2001. Canada: Issued by Franklin Templeton Investments Corp., 200 King Street West, Suite 1500 Toronto, ON, M5H3T4, Fax: (416) 364-1163, (800) 387-0830, www.franklintempleton.ca. Offshore Americas: In the U.S., this publication is made available by Franklin Templeton, One Franklin Parkway, San Mateo, California 94403-1906. Tel: (800) 239-3894 (USA Toll-Free), (877) 389-0076 (Canada Toll-Free), and Fax: (727) 299-8736. U.S. by Franklin Templeton, One Franklin Parkway, San Mateo, California 94403-1906, (800) DIAL BEN/342-5236, franklintempleton.com. Investments are not FDIC insured; may lose value; and are not bank guaranteed.
Issued in Europe by: Franklin Templeton International Services S.à r.l. – Supervised by the Commission de Surveillance du Secteur Financier – 8A, rue Albert Borschette, L-1246 Luxembourg. Tel: +352-46 66 67-1 Fax: +352-46 66 76. Poland: Issued by Templeton Asset Management (Poland) TFI S.A.; Rondo ONZ 1; 00-124 Warsaw. South Africa: Issued by Franklin Templeton Investments SA (PTY) Ltd, which is an authorized Financial Services Provider. Tel: +27 (21) 831 7400 Fax: +27 (21) 831 7422. Switzerland: Issued by Franklin Templeton Switzerland Ltd, Stockerstrasse 38, CH-8002 Zurich. United Arab Emirates: Issued by Franklin Templeton Investments (ME) Limited, authorized and regulated by the Dubai Financial Services Authority. Dubai office: Franklin Templeton, The Gate, East Wing, Level 2, Dubai International Financial Centre, P.O. Box 506613, Dubai, U.A.E. Tel: +9714-4284100 Fax: +9714-4284140. UK: Issued by Franklin Templeton Investment Management Limited (FTIML), registered office: Cannon Place, 78 Cannon Street, London EC4N 6HL. Tel: +44 (0)20 7073 8500. Authorized and regulated in the United Kingdom by the Financial Conduct Authority.
Australia: Issued by Franklin Templeton Australia Limited (ABN 76 004 835 849) (Australian Financial Services License Holder No. 240827), Level 47, 120 Collins Street, Melbourne, Victoria 3000. Hong Kong: Issued by Franklin Templeton Investments (Asia) Limited, 62/F, Two IFC, 8 Finance Street, Central, Hong Kong. Japan: Issued by Franklin Templeton Investments Japan Limited. Korea: Issued by Franklin Templeton Investment Trust Management Co., Ltd., 3rd fl., CCMM Building, 12 Youido-Dong, Youngdungpo-Gu, Seoul, Korea 150-968. Malaysia: Issued by Franklin Templeton Asset Management (Malaysia) Sdn. Bhd. & Franklin Templeton GSC Asset Management Sdn. Bhd. This document has not been reviewed by Securities Commission Malaysia. Singapore: Issued by Templeton Asset Management Ltd. Registration No. (UEN) 199205211E and Legg Mason Asset Management Singapore Pte. Limited, Registration Number (UEN) 200007942R. Legg Mason Asset Management Singapore Pte. Limited is an indirect wholly owned subsidiary of Franklin Resources, Inc. 7 Temasek Boulevard, #38-03 Suntec Tower One, 038987, Singapore.
Please visit www.franklinresources.com to be directed to your local Franklin Templeton website.
CFA® and Chartered Financial Analyst® are trademarks owned by CFA Institute.
__________
1. Source: Bloomberg, S&P. Indexes are unmanaged and one cannot directly invest in them. They do not include fees, expenses or sales charges. Past performance is not an indicator or a guarantee of future performance. See www.franklintempletondatasources.com for additional data provider information.
2. Alphabet (parent company of Google), Amazon, Apple, Meta (formerly Facebook), Microsoft, Nvidia and Tesla. These stocks were dubbed the Magnificent Seven in 2023 for their strong performance and resulting increased index concentration in recent years.
3. Sources: Bloomberg, S&P, Russell. Small cap stocks are defined by the Russell 2000 Index. The Russell 2000 Index is a small-cap US stock market index that makes up the smallest 2,000 stocks in the Russell Index. Indexes are unmanaged and one cannot directly invest in them. They do not include fees, expenses or sales charges. Past performance is not an indicator or a guarantee of future performance. See www.franklintempletondatasources.com for additional data provider information.