

In retrospect (and barring any impact from airline outages and the like), the first weekend of August would have been an excellent time for a vacation. Hopefully, you had a few screen-free days focused on a good beach book and spared yourself the anxiety of some wild market swings.
During this time of global market turmoil, Japan’s stock indexes experienced heightened volatility. A surge in the yen—that gave pause over the prospects of Japanese exporters—followed worrisome new US economic data and exacerbated fears. Over just two trading sessions, Japan’s benchmark Nikkei 225 Index dropped 12.4% on Monday, August 5, 2024, before rebounding over 10% the next day.1
Even investors who were blissfully unaware of the selloff drama in real time were probably still experiencing some creeping concerns over portfolio concentration to US technology giants. Judging by Wall Street’s elevated “fear gauge,” the VIX index,2 you’re in good company if this summer has tested your faith in the Magnificent Seven3 tech darlings.
But before any more panic sets in, consider a few points we’re thinking about this month. Namely, focusing on long-term investment strategy means ignoring the “bobs up and down,” as Warren Buffet puts it. US unemployment is still rather low at 4.3%4 and given that economic activity in the services sector expanded in July,5 we believe an imminent recessionary environment appears unlikely.
Historically, during cooling economic cycles, investors typically favor blue chips, but July’s moderating inflation data boosted sentiment for mid- and small-capitalization stocks. Both the Russell 2000 Index, which rose 10.2%, and the Russell Midcap Index, up 4.7%, outperformed the S&P 500 Index’s 1.2% gain for July.6
Overlooked mid- and small-cap segments
The market rotation away from mega-cap stocks has fueled attention to the often-overlooked, mid-cap segment and led to a preference for interest-rate-sensitive, small-cap stocks following indications from the US Federal Reserve (Fed) over lower borrowing costs to come, possibly in September.
Despite the attractive risk/reward profile of mid caps, which feature more established customer bases and brands than their smaller-cap peers, investors tend to be under-allocated to the segment. To put this in perspective, investments in large-cap mutual funds and exchange-traded funds (ETFs) are about nine times greater than those in mid-cap mutual funds and ETFs.7 US mid-cap stocks (as measured by the S&P MidCap 400 Index) have outperformed their large-cap (as measured by the S&P 500 Index) and small-cap (as measured by the S&P Small Cap 600 Index) counterparts over the past three decades.8 In our analysis, many mid-sized companies hit the so-called “sweet spot” in that they feature a lower risk profile than small caps and faster growth prospects than large caps.
Exposure to mid-caps indexes also offer the added benefit of diversification. At the end of July, technology sector holdings comprised 29% of the Russell 1000 Index compared to just 13% in the Russell Midcap Index.9 And while utility companies were the best performers (+18% total returns) for the mid-cap index, they held the smallest sector weighting within large-cap benchmarks.
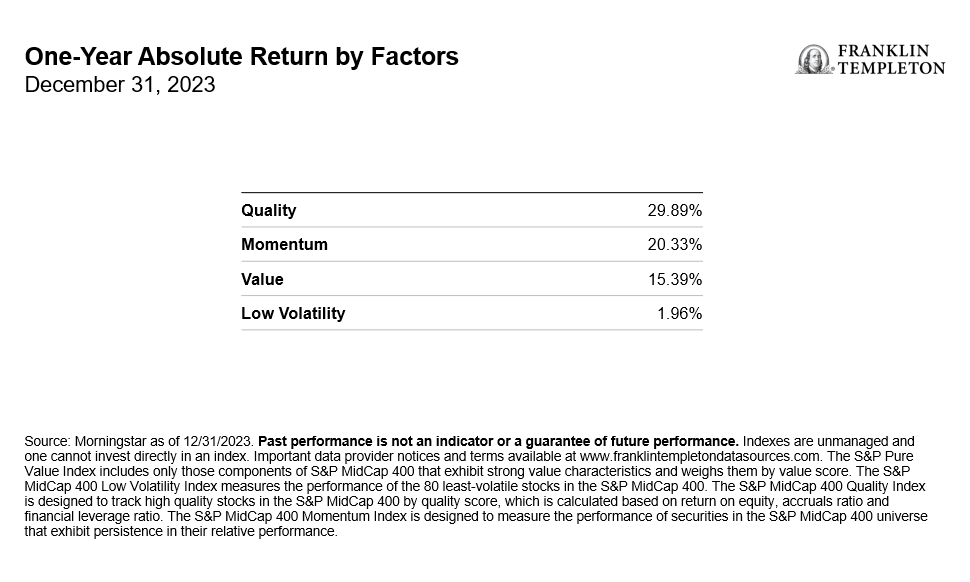
Beyond the market-cap criteria, we believe that multifactor strategies can target allocation and pursue stronger risk-adjusted returns for a smoother ride over the long term compared to traditional market-cap-based indexing. In our view, a forward-looking, rules-based index design that analyzes individual stock exposure against a well-vetted mix of factors—quality, value, momentum and low volatility—can serve as a middle ground between active and passive management. The process may provide exposure to high-quality companies at a reasonable price, while also potentially avoiding value traps.
As shown in the table below, quality-tilted and momentum stocks, which tend to show ongoing positive price trends, performed better than the broader market last year. The S&P MidCap 400 Quality Index and the S&P MidCap 400 Momentum Index, returned nearly 30% and 20.3%, respectively, for the year against the 16.4% gain for the overall S&P MidCap 400 Index.10 By comparison, the low volatility factor underperformed the most in 2023.
Exhibit 1: Differentiated Sources of Returns
The case for small caps
July’s broadened stock rally brings into view the market’s small-cap segment. That same month, the Russell 2000 Index of smaller stocks saw its largest outperformance over mega caps in decades, returning more than 10%, while the Nasdaq-100 Index lost 1.6%.11
Currently, at 15.1x forward earnings, the small-cap benchmark is trading at a discount to both its long-term average and the S&P 500’s forward price-earnings ratio of 20.4x.12 We believe that a multifactor approach to small caps, which we consider to be an attractive asset class, should be represented in diversified portfolios.
Stocks with value traits—which emphasize holdings that are inexpensive relative to their fundamentals—have underperformed in recent months and year-to-date through August 8, 2024, not only within the small-cap but also for the mid-cap segment. But zoom out further and we see that the Russell 2000 Value Index has outperformed the Russell 2000 Growth Index over the past 25 years by 1.82% on an annualized basis.13 In our opinion, anchoring quality-tilted stocks, marked by profitable companies with capital efficiency and momentum, together with value and low-volatility factors can hedge against risks.
Year-to-date through August 8, 2024, consumer staples holdings were the top performers for the small-cap index, with such specialty food companies as Vital Farms, Sprouts Farmers and Natural Grocers by Vitamin Cottage leading the way.14 Consumer staples tends to be a safe-haven sector that can outperform during times of uncertainty, such as amid periods of political uncertainty.
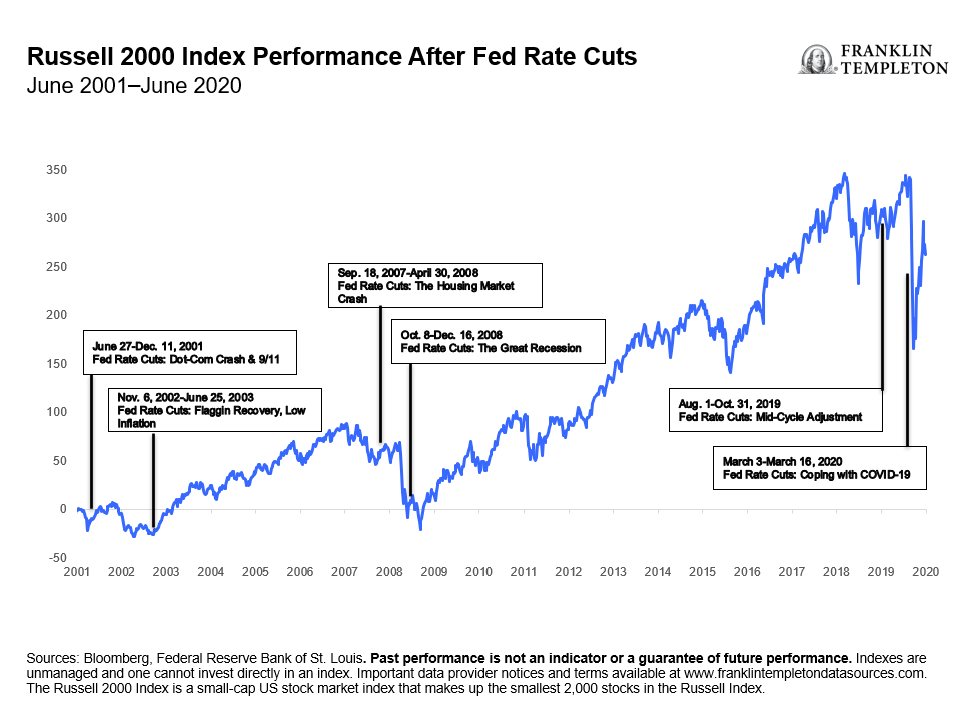
Being earlier in their business life cycle, small caps are generally seen to have strong growth prospects, and the segment has appealed to investors this year as a timely investment given anticipated rate cuts. Since smaller companies generally have more borrowing needs, they tend to get a boost when monetary policy eases.
Exhibit 2: Small-Cap Performance After Fed Rate Cuts
We believe that factor diversification can allow for a targeted outcome with a smoother risk/return profile versus market capitalization-based indexes. In addition, holding a multifactor portfolio can also provide the advantage of not attempting to time factor cycles, nor incur costs associated with switching from one product to another. A multifactor methodology allows investors to outsource that task—so your summer beach time can be better spent.
WHAT ARE THE RISKS?
All investments involve risks, including possible loss of principal. Equity securities are subject to price fluctuation and possible loss of principal. Small- and mid-cap stocks involve greater risks and volatility than large-cap stocks. Large-capitalization companies may fall out of favor with investors based on market and economic conditions.
There can be no assurance that a multifactor stock selection process will enhance performance. Exposure to such investment factors may detract from performance in some market environments, perhaps for extended periods.
International investments are subject to special risks, including currency fluctuations and social, economic and political uncertainties, which could increase volatility. These risks are magnified in emerging markets.
ETFs trade like stocks, fluctuate in market value and may trade above or below the ETF’s net asset value. Brokerage commissions and ETF expenses will reduce returns. ETF shares may be bought or sold throughout the day at their market price on the exchange on which they are listed. However, there can be no guarantee that an active trading market for ETF shares will be developed or maintained or that their listing will continue or remain unchanged. While the shares of ETFs are tradable on secondary markets, they may not readily trade in all market conditions and may trade at significant discounts in periods of market stress.
Any companies and/or case studies referenced herein are used solely for illustrative purposes; any investment may or may not be currently held by any portfolio advised by Franklin Templeton. The information provided is not a recommendation or individual investment advice for any particular security, strategy, or investment product and is not an indication of the trading intent of any Franklin Templeton managed portfolio.
IMPORTANT LEGAL INFORMATION
This material is intended to be of general interest only and should not be construed as individual investment advice or a recommendation or solicitation to buy, sell or hold any security or to adopt any investment strategy. It does not constitute legal or tax advice. This material may not be reproduced, distributed or published without prior written permission from Franklin Templeton.
The views expressed are those of the investment manager and the comments, opinions and analyses are rendered as at publication date and may change without notice. The underlying assumptions and these views are subject to change based on market and other conditions and may differ from other portfolio managers or of the firm as a whole. The information provided in this material is not intended as a complete analysis of every material fact regarding any country, region or market. There is no assurance that any prediction, projection or forecast on the economy, stock market, bond market or the economic trends of the markets will be realized. The value of investments and the income from them can go down as well as up and you may not get back the full amount that you invested. Past performance is not necessarily indicative nor a guarantee of future performance. All investments involve risks, including possible loss of principal.
Any research and analysis contained in this material has been procured by Franklin Templeton for its own purposes and may be acted upon in that connection and, as such, is provided to you incidentally. Data from third party sources may have been used in the preparation of this material and Franklin Templeton (“FT”) has not independently verified, validated or audited such data. Although information has been obtained from sources that Franklin Templeton believes to be reliable, no guarantee can be given as to its accuracy and such information may be incomplete or condensed and may be subject to change at any time without notice. The mention of any individual securities should neither constitute nor be construed as a recommendation to purchase, hold or sell any securities, and the information provided regarding such individual securities (if any) is not a sufficient basis upon which to make an investment decision. FT accepts no liability whatsoever for any loss arising from use of this information and reliance upon the comments, opinions and analyses in the material is at the sole discretion of the user.
Products, services and information may not be available in all jurisdictions and are offered outside the U.S. by other FT affiliates and/or their distributors as local laws and regulation permits. Please consult your own financial professional or Franklin Templeton institutional contact for further information on availability of products and services in your jurisdiction.
Brazil: Issued by Franklin Templeton Investimentos (Brasil) Ltda., authorized to render investment management services by CVM per Declaratory Act n. 6.534, issued on October 1, 2001. Canada: Issued by Franklin Templeton Investments Corp., 200 King Street West, Suite 1500 Toronto, ON, M5H3T4, Fax: (416) 364-1163, (800) 387-0830, www.franklintempleton.ca. Offshore Americas: In the U.S., this publication is made available by Franklin Templeton, One Franklin Parkway, San Mateo, California 94403-1906. Tel: (800) 239-3894 (USA Toll-Free), (877) 389-0076 (Canada Toll-Free), and Fax: (727) 299-8736. U.S. by Franklin Templeton, One Franklin Parkway, San Mateo, California 94403-1906, (800) DIAL BEN/342-5236, www.franklintempleton.com. Investments are not FDIC insured; may lose value; and are not bank guaranteed.
Issued in Europe by: Franklin Templeton International Services S.à r.l. – Supervised by the Commission de Surveillance du Secteur Financier – 8A, rue Albert Borschette, L-1246 Luxembourg. Tel: +352-46 66 67-1 Fax: +352-46 66 76. Poland: Issued by Templeton Asset Management (Poland) TFI S.A.; Rondo ONZ 1; 00-124 Warsaw. South Africa: Issued by Franklin Templeton Investments SA (PTY) Ltd, which is an authorised Financial Services Provider. Tel: +27 (21) 831 7400 Fax: +27 (21) 831 7422. Switzerland: Issued by Franklin Templeton Switzerland Ltd, Stockerstrasse 38, CH-8002 Zurich. United Arab Emirates: Issued by Franklin Templeton Investments (ME) Limited, authorized and regulated by the Dubai Financial Services Authority. Dubai office: Franklin Templeton, The Gate, East Wing, Level 2, Dubai International Financial Centre, P.O. Box 506613, Dubai, U.A.E. Tel: +9714-4284100 Fax: +9714-4284140. UK: Issued by Franklin Templeton Investment Management Limited (FTIML), registered office: Cannon Place, 78 Cannon Street, London EC4N 6HL. Tel: +44 (0)20 7073 8500. Authorized and regulated in the United Kingdom by the Financial Conduct Authority.
Australia: Issued by Franklin Templeton Australia Limited (ABN 76 004 835 849) (Australian Financial Services License Holder No. 240827), Level 47, 120 Collins Street, Melbourne, Victoria 3000. Hong Kong: Issued by Franklin Templeton Investments (Asia) Limited, 62/F, Two IFC, 8 Finance Street, Central, Hong Kong. Japan: Issued by Franklin Templeton Investments Japan Limited. Korea: Issued by Franklin Templeton Investment Trust Management Co., Ltd., 3rd fl., CCMM Building, 12 Youido-Dong, Youngdungpo-Gu, Seoul, Korea 150-968. Malaysia: Issued by Franklin Templeton Asset Management (Malaysia) Sdn. Bhd. & Franklin Templeton GSC Asset Management Sdn. Bhd. This document has not been reviewed by Securities Commission Malaysia. Singapore: Issued by Templeton Asset Management Ltd. Registration No. (UEN) 199205211E and Legg Mason Asset Management Singapore Pte. Limited, Registration Number (UEN) 200007942R. Legg Mason Asset Management Singapore Pte. Limited is an indirect wholly owned subsidiary of Franklin Resources, Inc. 7 Temasek Boulevard, #38-03 Suntec Tower One, 038987, Singapore.
Please visit www.franklinresources.com to be directed to your local Franklin Templeton website.
CFA® and Chartered Financial Analyst® are trademarks owned by CFA Institute.
__________
1. Source: Bloomberg. Past performance is not an indicator or a guarantee of future performance. Indexes are unmanaged and one cannot invest directly in an index. Important data provider notices and terms available at www.franklintempletondatasources.com. The Nikkei 225, or the Nikkei Stock Average, more commonly called the Nikkei or the Nikkei index, is a stock market index for the Tokyo Stock Exchange. It is a price-weighted index, operating in the Japanese Yen, and its components are reviewed twice a year.
2. The VIX index is the popular name of the Chicago Board of Exchange Volatility Index, a popular measure of the stock market’s expectation of volatility based on S&P 500 Index options. Often called the “fear gauge”, lower readings suggest a perceived low-risk environment, while higher readings suggest a period of higher volatility.
3. Alphabet (parent company of Google), Amazon, Apple, Meta (formerly Facebook), Microsoft, Nvidia and Tesla. These stocks were dubbed the Magnificent Seven in 2023 for their strong performance and resulting increased index concentration in recent years.
4. Source: Bureau of Labor Statistics. August 2, 2024.
5. Source: Institute for Supply Management. August 5, 2024.
6. Source: Bloomberg. Past performance is not an indicator or a guarantee of future performance. Indexes are unmanaged and one cannot invest directly in an index. Important data provider notices and terms available at www.franklintempletondatasources.com. The Russell 2000 Index is a small-cap US stock market index that makes up the smallest 2,000 stocks in the Russell Index. The Russell Midcap Index measures performance of the 800 smallest companies in the Russell 1000 Index.
7. Source: Morningstar, as of July 17, 2024. Compares Morningstar large-cap blend/growth value categories vs. mid-cap blend/growth value categories.
8. Source: Bloomberg Finance L.P., January 1, 1994–March 31, 2024, based on calendar year returns. Past performance is not an indicator or a guarantee of future performance. Indexes are unmanaged and one cannot invest directly in an index. Important data provider notices and terms available at www.franklintempletondatasources.com. The S&P MidCap 400 Index serves as a gauge for the US mid-cap equities sector and is the most widely followed mid-cap index. The S&P Small Cap 600 Index overs roughly the small-cap range of American stocks, using a capitalization-weighted index. To be included in the index, a stock must have a total market capitalization that ranges from US$1 billion to US$6.7 billion.
9. Source: Bloomberg. The Russell 1000 Index is a US stock market index that tracks the highest-ranking 1,000 stocks in the Russell 3000 Index, which represent about 93% of the total market capitalization of that index.
10. Source: Morningstar as of December 30, 2023.
11. Source: Bloomberg. Past performance is not an indicator or a guarantee of future performance. Indexes are unmanaged and one cannot invest directly in an index. Important data provider notices and terms available at www.franklintempletondatasources.com. The Nasdaq-100 is a stock market index made up of equity securities issued by 100 of the largest non-financial companies listed on the Nasdaq stock exchange. It is a modified capitalization-weighted index.
12. Source: Bloomberg. There is no assurance that any estimate, forecast or projection will be realized.
13. Source: Bloomberg. Past performance is not an indicator or a guarantee of future performance. Indexes are unmanaged and one cannot invest directly in an index. Important data provider notices and terms available at www.franklintempletondatasources.com. The Russell 2000 Value Index measures the performance of the small-cap value segment of the US equity universe. The Russell 2000 Growth Index measures the performance of the small-cap growth segment of the US equity universe.
14. Source: Bloomberg. August 8, 2024.