

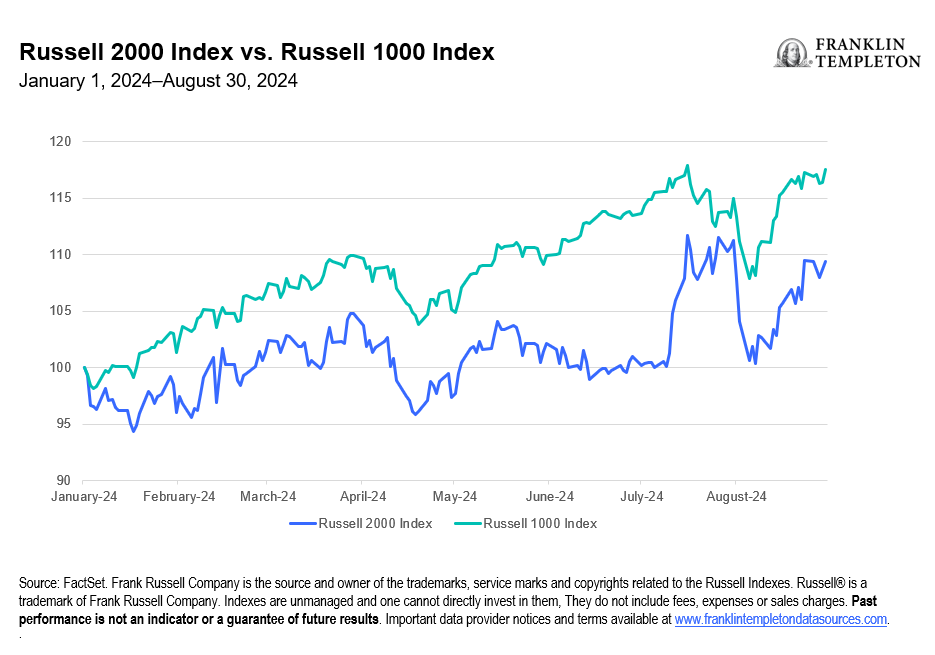
Small-cap stocks surged in July then dropped in early August before mounting another climb. The rollercoaster ride at least temporarily breathed new life into what has been an unloved asset class. Although the Russell 2000 Index rose over 10% in July on hopes lower inflation will lead to rate cuts, it failed to eclipse recent highs amid the ongoing worries about interest rates, inflation and the possibility of a recession. It also has lagged the large-cap Russell 1000 this year. (See Exhibit 1.)
We believe that enduring success in small-cap investing will come down to active management focused on profitable, higher-quality stocks, which we define as stocks with positive or growing earnings and low leverage, stable business models and good corporate governance, trading at depressed prices relative to their future earnings power.
Exhibit 1: Russell 2000 Index vs. Russell 1000 Index
Look beneath the surface
Smaller companies tend to be more economically sensitive and have more debt, particularly variable rate debt, than larger firms. That makes them more likely to benefit from optimism about the economy and lower interest rates which can potentially reduce their borrowing costs.
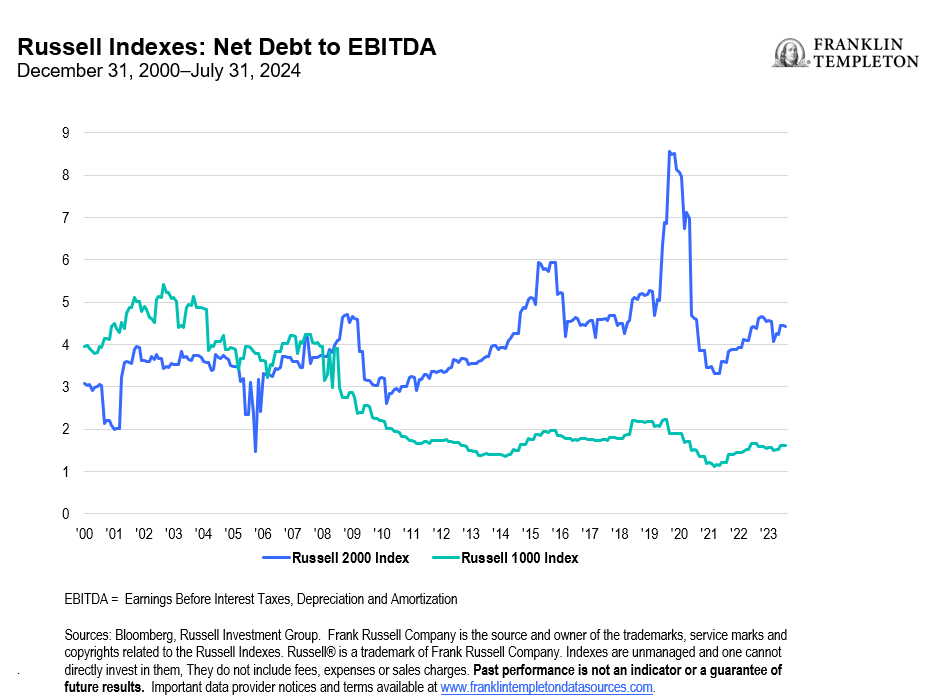
On the surface, small-cap stocks have been criticized for their excessive debts, but a deeper look can uncover those with much stronger balance sheets and appealing earnings growth profiles. On average, companies in the Russell 2000 Index have a net debt/EBITDA (earnings before interest, taxes, depreciation, and amortization) ratio of 4.4 times as of July 2024, much higher than the 1.6 times for the larger, more established companies in the Russell 1000 Index. (See Exhibit 2.)
Exhibit 2: Russell Indexes: Net Debt to EBITDA
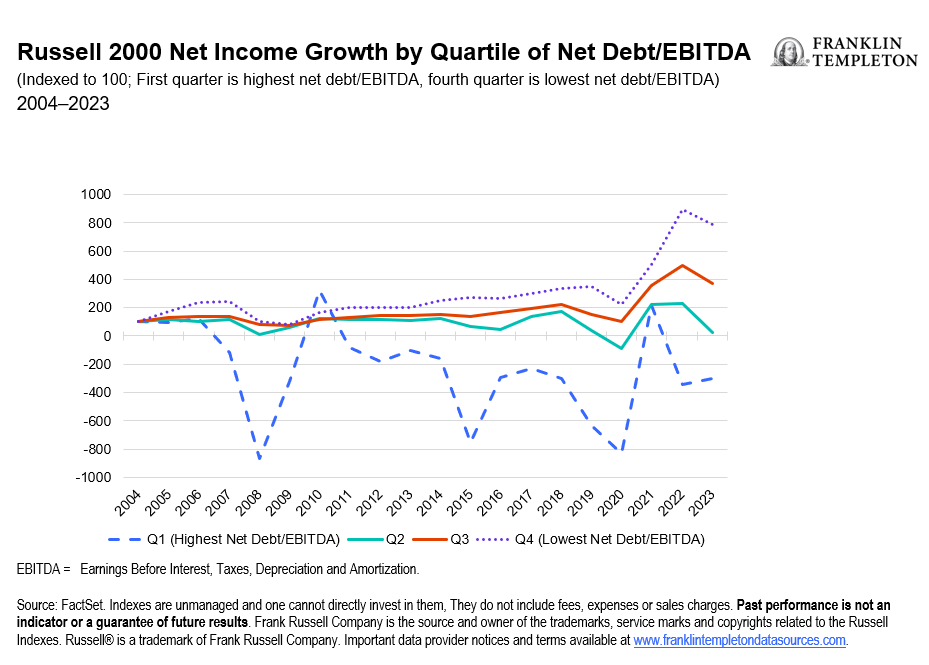
Plenty of growing small-cap stocks with low debt levels exist and we use deep, fundamental research to find them. Grouping stocks in the Russell 2000 Index into quartiles by net debt/EBITDA, for example, allows us to find companies with less debt posting faster compound annual net income growth than more indebted ones.
The least indebted companies in the fourth quartile posted the fastest compound annual growth rate (CAGR) for of 15% from 2004 to 2023, according to data from FactSet. More highly indebted companies in the second quartile saw their net income decline at a 6% CAGR.
Moreover, net income in the third and fourth quartiles, where leverage is the lowest, grew over the past 20 years (See Exhibit 3), while the most indebted companies in the first quartile saw substantial net income volatility.
Exhibit 3: Russell 2000 Net Income Growth by Quartile of Net Debt/EBITDA
Follow the earnings growth
Although approximately 40% of companies in the Russell 2000 do not make money, positive- earning small-cap value stocks members of the Russell 2000 Value Index have actually seen earnings per share expand at a CAGR of 6.1% over the past two decades, just a bit less than the broader Russell 2000’s 6.9% CAGR. (See Exhibit 4.)
Exhibit 4: Earnings Per Share: Russell 2000 Value vs. Russell 2000 Index
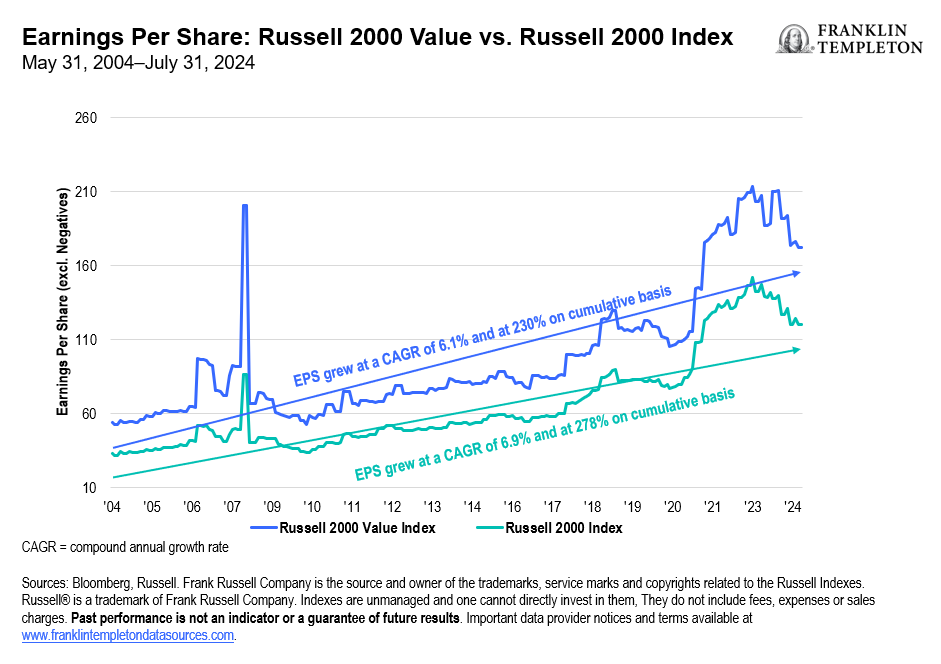
Furthermore, profitable small-cap value companies are forecast to deliver earnings growth of about 16% from 2024 into 2025, according to estimates from data provider Bloomberg.1 All this suggests to us that investors can find quality, small-cap value companies that are growing nearly as fast as some growth companies but at much more appealing valuations.
Seek valuation support
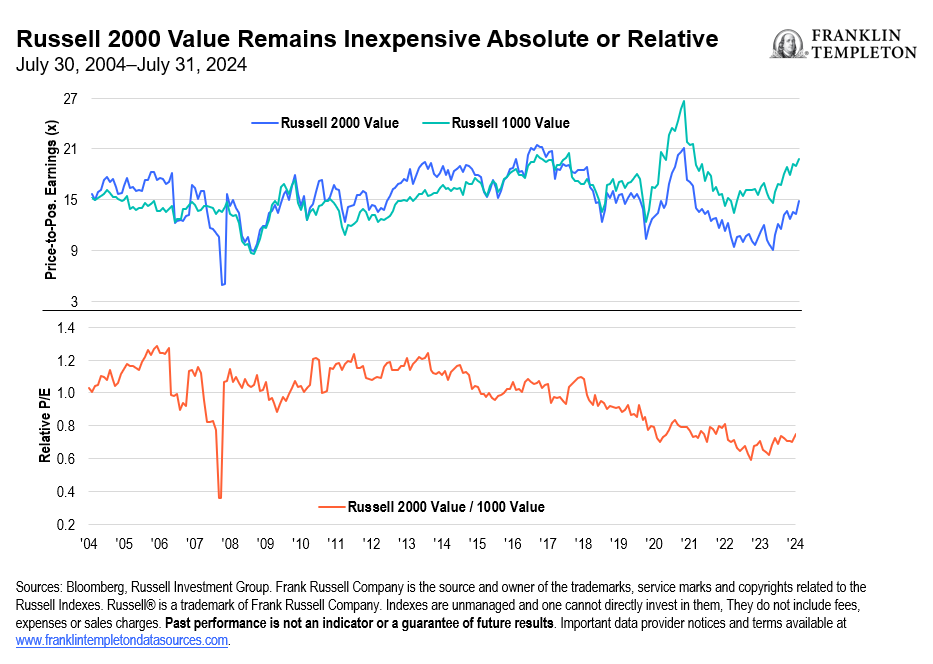
Stock valuations remain a crucial variable in an active approach to small-cap investing, as they may not fully reflect the group’s earnings potential. Small-cap equities remain much less expensive than large-cap stocks on both an absolute and relative basis, with the valuation differential near 10-year lows. (See Exhibit 5.)
Exhibit 5: Russell 2000 Value Remains Inexpensive Absolute or Relative
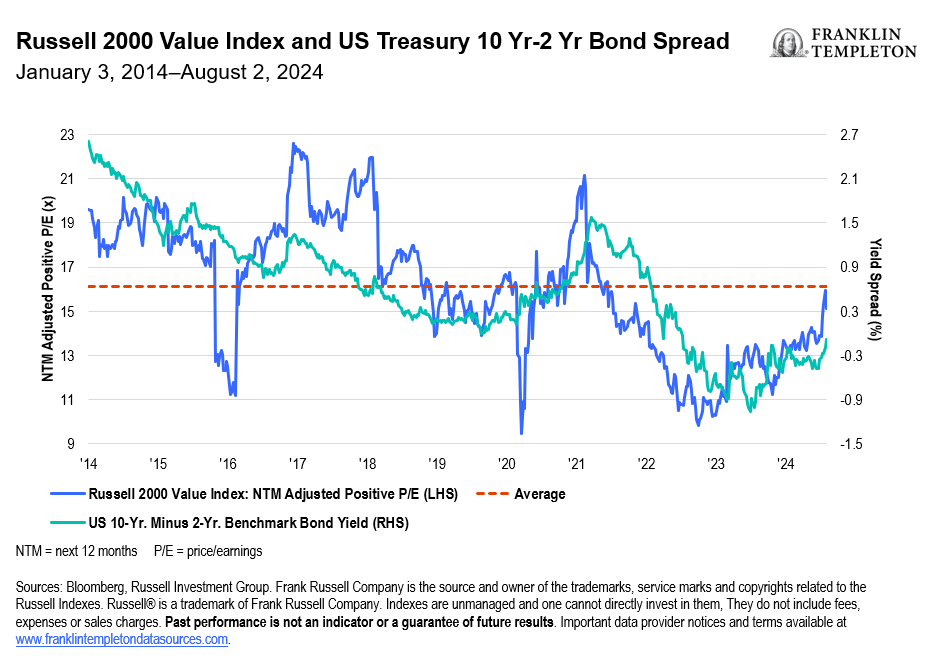
Furthermore, a continued inflection in the yield curve, given the possibility for interest-rate cuts over the remainder of the year, could serve as a catalyst to help further push cheaper, smaller stocks higher. (See Exhibit 6.)
Exhibit 6: Russell 2000 Value Index and US Treasury 10 Year-2 Year Bond Spread
While the asset class may look broadly appealing on a valuation basis, we believe consideration of companies’ leverage and earnings growth profiles is key to finding those that can outperform over time. In our view, deep active management is crucial for a calmer ride in small-cap investing.
Indexes referenced
The Russell 2000 Index is a small-cap US stock market index that makes up the smallest 2,000 stocks in the Russell Index. The Russell 1000 Index is a US stock market index that tracks the highest-ranking 1,000 stocks in the Russell 3000 Index, which represent about 93% of the total market capitalization of that index.
The Russell 2000 Value Index measures the performance of the small-cap value segment of the US equity universe. The Russell 1000 Value Index measures the performance of the large-cap value segment of the US equity universe.
WHAT ARE THE RISKS?
All investments involve risks, including possible loss of principal. Equity securities are subject to price fluctuation and possible loss of principal. Small- and mid-cap stocks involve greater risks and volatility than large-cap stocks. Active management does not ensure gains or protect against market declines.
IMPORTANT LEGAL INFORMATION
This material is intended to be of general interest only and should not be construed as individual investment advice or a recommendation or solicitation to buy, sell or hold any security or to adopt any investment strategy. It does not constitute legal or tax advice. This material may not be reproduced, distributed or published without prior written permission from Franklin Templeton.
The views expressed are those of the investment manager and the comments, opinions and analyses are rendered as at publication date and may change without notice. The underlying assumptions and these views are subject to change based on market and other conditions and may differ from other portfolio managers or of the firm as a whole. The information provided in this material is not intended as a complete analysis of every material fact regarding any country, region or market. There is no assurance that any prediction, projection or forecast on the economy, stock market, bond market or the economic trends of the markets will be realized. The value of investments and the income from them can go down as well as up and you may not get back the full amount that you invested. Past performance is not necessarily indicative nor a guarantee of future performance. All investments involve risks, including possible loss of principal.
Any research and analysis contained in this material has been procured by Franklin Templeton for its own purposes and may be acted upon in that connection and, as such, is provided to you incidentally. Data from third party sources may have been used in the preparation of this material and Franklin Templeton (“FT”) has not independently verified, validated or audited such data. Although information has been obtained from sources that Franklin Templeton believes to be reliable, no guarantee can be given as to its accuracy and such information may be incomplete or condensed and may be subject to change at any time without notice. The mention of any individual securities should neither constitute nor be construed as a recommendation to purchase, hold or sell any securities, and the information provided regarding such individual securities (if any) is not a sufficient basis upon which to make an investment decision. FT accepts no liability whatsoever for any loss arising from use of this information and reliance upon the comments, opinions and analyses in the material is at the sole discretion of the user.
Products, services and information may not be available in all jurisdictions and are offered outside the U.S. by other FT affiliates and/or their distributors as local laws and regulation permits. Please consult your own financial professional or Franklin Templeton institutional contact for further information on availability of products and services in your jurisdiction.
Brazil: Issued by Franklin Templeton Investimentos (Brasil) Ltda., authorized to render investment management services by CVM per Declaratory Act n. 6.534, issued on October 1, 2001. Canada: Issued by Franklin Templeton Investments Corp., 200 King Street West, Suite 1500 Toronto, ON, M5H3T4, Fax: (416) 364-1163, (800) 387-0830, www.franklintempleton.ca. Offshore Americas: In the U.S., this publication is made available by Franklin Templeton, One Franklin Parkway, San Mateo, California 94403-1906. Tel: (800) 239-3894 (USA Toll-Free), (877) 389-0076 (Canada Toll-Free), and Fax: (727) 299-8736. U.S. by Franklin Templeton, One Franklin Parkway, San Mateo, California 94403-1906, (800) DIAL BEN/342-5236, www.franklintempleton.com. Investments are not FDIC insured; may lose value; and are not bank guaranteed.
Issued in Europe by: Franklin Templeton International Services S.à r.l. – Supervised by the Commission de Surveillance du Secteur Financier – 8A, rue Albert Borschette, L-1246 Luxembourg. Tel: +352-46 66 67-1 Fax: +352-46 66 76. Poland: Issued by Templeton Asset Management (Poland) TFI S.A.; Rondo ONZ 1; 00-124 Warsaw. South Africa: Issued by Franklin Templeton Investments SA (PTY) Ltd, which is an authorized Financial Services Provider. Tel: +27 (21) 831 7400 Fax: +27 (21) 831 7422. Switzerland: Issued by Franklin Templeton Switzerland Ltd, Stockerstrasse 38, CH-8002 Zurich. United Arab Emirates: Issued by Franklin Templeton Investments (ME) Limited, authorized and regulated by the Dubai Financial Services Authority. Dubai office: Franklin Templeton, The Gate, East Wing, Level 2, Dubai International Financial Centre, P.O. Box 506613, Dubai, U.A.E. Tel: +9714-4284100 Fax: +9714-4284140. UK: Issued by Franklin Templeton Investment Management Limited (FTIML), registered office: Cannon Place, 78 Cannon Street, London EC4N 6HL. Tel: +44 (0)20 7073 8500. Authorized and regulated in the United Kingdom by the Financial Conduct Authority.
Australia: Issued by Franklin Templeton Australia Limited (ABN 76 004 835 849) (Australian Financial Services License Holder No. 240827), Level 47, 120 Collins Street, Melbourne, Victoria 3000. Hong Kong: Issued by Franklin Templeton Investments (Asia) Limited, 62/F, Two IFC, 8 Finance Street, Central, Hong Kong. Japan: Issued by Franklin Templeton Investments Japan Limited. Korea: Issued by Franklin Templeton Investment Trust Management Co., Ltd., 3rd fl., CCMM Building, 12 Youido-Dong, Youngdungpo-Gu, Seoul, Korea 150-968. Malaysia: Issued by Franklin Templeton Asset Management (Malaysia) Sdn. Bhd. & Franklin Templeton GSC Asset Management Sdn. Bhd. This document has not been reviewed by Securities Commission Malaysia. Singapore: Issued by Templeton Asset Management Ltd. Registration No. (UEN) 199205211E and Legg Mason Asset Management Singapore Pte. Limited, Registration Number (UEN) 200007942R. Legg Mason Asset Management Singapore Pte. Limited is an indirect wholly owned subsidiary of Franklin Resources, Inc. 7 Temasek Boulevard, #38-03 Suntec Tower One, 038987, Singapore.
Please visit www.franklinresources.com to be directed to your local Franklin Templeton website.
CFA® and Chartered Financial Analyst® are trademarks owned by CFA Institute.
______________________
1. As of July 31, 2024. There is no assurance that any estimate, forecast or projection will be realized.