

In response to decades-high inflation levels, the US Federal Reserve (Fed) started raising the fed funds rate at a rapid pace beginning in 2022. As the Fed hiked 11 times from March 2022 through July 2023 and the fed funds rate reached 5.25%-5.50%, yields became increasingly attractive for short-term investments such as cash and money market funds. With fed funds rate at a peak, investors are asking “what should we be doing with our fixed income allocation?” We evaluate historical inflection points for fed funds rates to explore the impact on various fixed income sectors and resulting investment opportunities.
After decades of historically low rates, the rapid rise in short-end yields and the resulting inverted US Treasury yield curve led investors to reduce their traditional fixed income allocations, shorten their duration, or pile into cash or money market vehicles. However, the Fed itself has acknowledged that short-term rates have peaked, and Fed Chair Jerome Powell has signaled to the market that the next move in the fed funds rate is going to be a cut.
The timing and speed of rate cuts is open to debate, but we feel cuts will come at a moderate pace over the next few years.
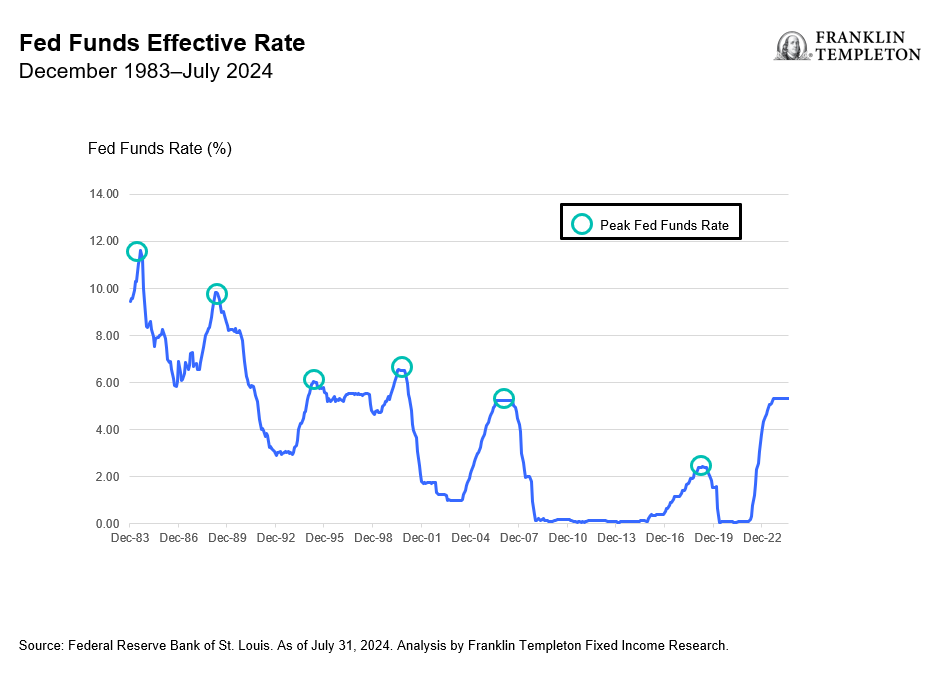
To better guide decisions on fixed income allocations around changes in Fed policy, history may provide a useful framework for how to navigate the current environment. In plotting the effective funds rate beginning in 1983, we can identify six distinct peaks in the effective rate, coinciding with either prolonged pauses or the beginning of rate cuts.
Those peaks were in: (1) August 1984, (2) February 1989, (3) February 1995, (4) May 2000, (5) June 2006, and (6) December 2018.
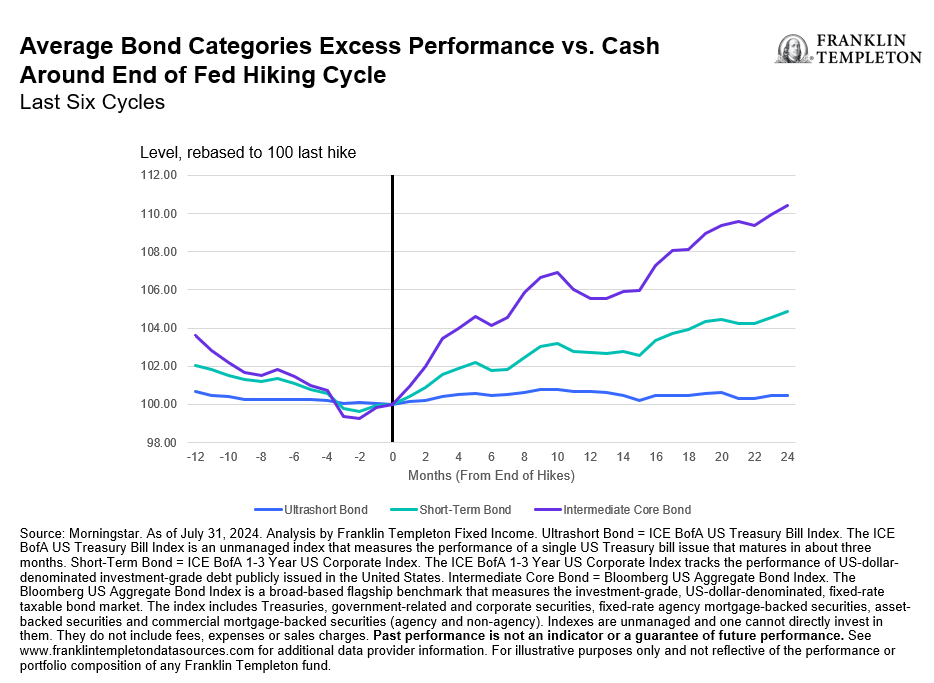
By analyzing historical fixed income returns during these periods, we can identify key themes to guide investors in making allocation decisions. We have used average return data from Morningstar, which allows us to observe a bias-free time series of the average performance of funds in three key fixed income categories: (1) ultrashort bond, (2) short-term bond, and (3) intermediate core bond. We focused on these three as they are representative of various risk and duration postures investors typically allocate to within their fixed income exposure. We then measured the average cumulative performance versus cash in the 12 months prior to the end of a Fed hiking cycle and the subsequent 24 months.
There is a clear trend where all three investment categories underperformed cash in the 12 months before the end of the cycle, while relative returns were consistent with the duration of each category (i.e. ultrashort underperformed by the least, while intermediate core bond the most). The chart below also highlights that these categories began to outperform cash after the end of the average hiking cycle, with longer-duration profiles having performed the best. Our analysis also shows that the longer-duration categories such as intermediate core bond, which is benchmarked to the Bloomberg Aggregate Bond Index, started to outperform two to three months prior to the last hike.
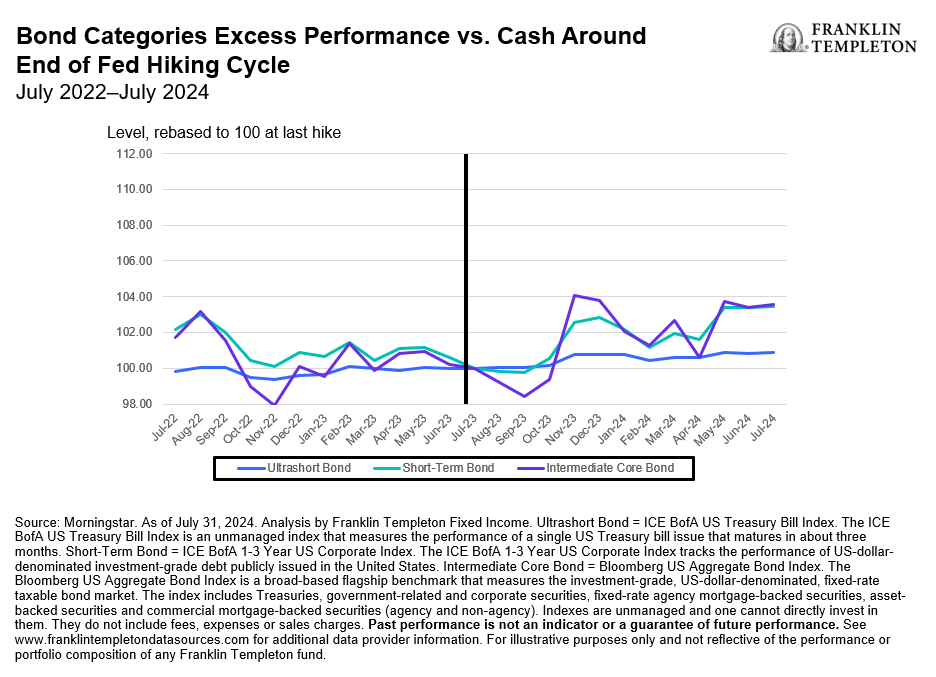
One could argue that history may not be a useful guide given the uniqueness of the current cycle due to how aggressive the Fed was in raising interest rates and what we expect to be a prolonged and shallow rate-cutting cycle. We would suggest that, despite the nature of the most recent monetary cycle, performance is largely following the same general path as we have seen historically. The next chart shows the excess returns of each category versus cash in the current cycle. The underperformance for both the ultrashort bond and short-term bond categories in the 12-month period before the last hike are in line with historical averages. While the intermediate core bond category experienced a slightly larger drawdown, it is not a historical outlier.
Furthermore, all three categories have delivered positive excess returns since July 2023, the last time the Fed hiked rates. This extended period between Fed moves (currently 13 months on “pause”) has suppressed the magnitude of excess returns versus previous cycles, where the time between a Fed pause and eventual cut was shorter on average. However, excess returns may begin to align with historical averages as the Fed policy shifts to an easing cycle.
In our view, the fed funds rate is at a peak, and we are about to enter a rate-cutting cycle. As such, we believe now may be an attractive time to look for strategies that have historically outperformed cash after the Fed begins to shift its policy stance.
- Ultrashort bond: for investors who have historically looked to the category as a step above cash or have a time horizon for cash needs within a year.
- Short-term bond: for investors looking to extend duration while still being shorter duration than Bloomberg Aggregate, want high-quality portfolio, and/or have a time horizon inside of two years.
- Core bond: for investors that want intermediate duration exposure, similar to the Bloomberg Aggregate Index, in a diversified and high-quality fixed income portfolio.
WHAT ARE THE RISKS?
All investments involve risks, including possible loss of principal.
Fixed income securities involve interest rate, credit, inflation and reinvestment risks, and possible loss of principal. As interest rates rise, the value of fixed income securities falls.
IMPORTANT LEGAL INFORMATION
This material is intended to be of general interest only and should not be construed as individual investment advice or a recommendation or solicitation to buy, sell or hold any security or to adopt any investment strategy. It does not constitute legal or tax advice. This material may not be reproduced, distributed or published without prior written permission from Franklin Templeton.
The views expressed are those of the investment manager and the comments, opinions and analyses are rendered as at publication date and may change without notice. The underlying assumptions and these views are subject to change based on market and other conditions and may differ from other portfolio managers or of the firm as a whole. The information provided in this material is not intended as a complete analysis of every material fact regarding any country, region or market. There is no assurance that any prediction, projection or forecast on the economy, stock market, bond market or the economic trends of the markets will be realized. The value of investments and the income from them can go down as well as up and you may not get back the full amount that you invested. Past performance is not necessarily indicative nor a guarantee of future performance. All investments involve risks, including possible loss of principal.
Any research and analysis contained in this material has been procured by Franklin Templeton for its own purposes and may be acted upon in that connection and, as such, is provided to you incidentally. Data from third party sources may have been used in the preparation of this material and Franklin Templeton (“FT”) has not independently verified, validated or audited such data. Although information has been obtained from sources that Franklin Templeton believes to be reliable, no guarantee can be given as to its accuracy and such information may be incomplete or condensed and may be subject to change at any time without notice. The mention of any individual securities should neither constitute nor be construed as a recommendation to purchase, hold or sell any securities, and the information provided regarding such individual securities (if any) is not a sufficient basis upon which to make an investment decision. FT accepts no liability whatsoever for any loss arising from use of this information and reliance upon the comments, opinions and analyses in the material is at the sole discretion of the user.
Products, services and information may not be available in all jurisdictions and are offered outside the U.S. by other FT affiliates and/or their distributors as local laws and regulation permits. Please consult your own financial professional or Franklin Templeton institutional contact for further information on availability of products and services in your jurisdiction.
Brazil: Issued by Franklin Templeton Investimentos (Brasil) Ltda., authorized to render investment management services by CVM per Declaratory Act n. 6.534, issued on October 1, 2001. Canada: Issued by Franklin Templeton Investments Corp., 200 King Street West, Suite 1500 Toronto, ON, M5H3T4, Fax: (416) 364-1163, (800) 387-0830, www.franklintempleton.ca. Offshore Americas: In the U.S., this publication is made available by Franklin Templeton, One Franklin Parkway, San Mateo, California 94403-1906. Tel: (800) 239-3894 (USA Toll-Free), (877) 389-0076 (Canada Toll-Free), and Fax: (727) 299-8736. U.S. by Franklin Templeton, One Franklin Parkway, San Mateo, California 94403-1906, (800) DIAL BEN/342-5236, franklintempleton.com. Investments are not FDIC insured; may lose value; and are not bank guaranteed.
Issued in Europe by: Franklin Templeton International Services S.à r.l. – Supervised by the Commission de Surveillance du Secteur Financier – 8A, rue Albert Borschette, L-1246 Luxembourg. Tel: +352-46 66 67-1 Fax: +352-46 66 76. Poland: Issued by Templeton Asset Management (Poland) TFI S.A.; Rondo ONZ 1; 00-124 Warsaw. South Africa: Issued by Franklin Templeton Investments SA (PTY) Ltd, which is an authorized Financial Services Provider. Tel: +27 (21) 831 7400 Fax: +27 (21) 831 7422. Switzerland: Issued by Franklin Templeton Switzerland Ltd, Stockerstrasse 38, CH-8002 Zurich. United Arab Emirates: Issued by Franklin Templeton Investments (ME) Limited, authorized and regulated by the Dubai Financial Services Authority. Dubai office: Franklin Templeton, The Gate, East Wing, Level 2, Dubai International Financial Centre, P.O. Box 506613, Dubai, U.A.E. Tel: +9714-4284100 Fax: +9714-4284140. UK: Issued by Franklin Templeton Investment Management Limited (FTIML), registered office: Cannon Place, 78 Cannon Street, London EC4N 6HL. Tel: +44 (0)20 7073 8500. Authorized and regulated in the United Kingdom by the Financial Conduct Authority.
Australia: Issued by Franklin Templeton Australia Limited (ABN 76 004 835 849) (Australian Financial Services License Holder No. 240827), Level 47, 120 Collins Street, Melbourne, Victoria 3000. Hong Kong: Issued by Franklin Templeton Investments (Asia) Limited, 62/F, Two IFC, 8 Finance Street, Central, Hong Kong. Japan: Issued by Franklin Templeton Investments Japan Limited. Korea: Issued by Franklin Templeton Investment Trust Management Co., Ltd., 3rd fl., CCMM Building, 12 Youido-Dong, Youngdungpo-Gu, Seoul, Korea 150-968. Malaysia: Issued by Franklin Templeton Asset Management (Malaysia) Sdn. Bhd. & Franklin Templeton GSC Asset Management Sdn. Bhd. This document has not been reviewed by Securities Commission Malaysia. Singapore: Issued by Templeton Asset Management Ltd. Registration No. (UEN) 199205211E and Legg Mason Asset Management Singapore Pte. Limited, Registration Number (UEN) 200007942R. Legg Mason Asset Management Singapore Pte. Limited is an indirect wholly owned subsidiary of Franklin Resources, Inc. 7 Temasek Boulevard, #38-03 Suntec Tower One, 038987, Singapore.
Please visit www.franklinresources.com to be directed to your local Franklin Templeton website.
Copyright © 2024 Franklin Templeton. All rights reserved.