
 English
 简体中文
简体中文 Italiano
 Español
This post is also available in: Chinese (Simplified) Italian Spanish
Despite what we believe to be attractive investment opportunities across Japan, we would be remiss not to recognize the considerable weakness exhibited by the Japanese yen (JPY) year to date, which has seen a nearly 14% depreciation relative to the US dollar since the start of the year.1 This weakness has been driven in part by remarks from the Bank of Japan (BOJ), which has indicated its intention to maintain a relatively accommodative monetary stance—in contrast to policy measures of other global central banks. Across several other regions, governments and policymakers are seeking to combat historically high rates of inflation by either tapering asset purchases or increasing policy rates. Notably, comments from other central banks throughout the course of the first quarter of 2022 suggest that the move to higher interest rates may potentially be more aggressive than previously estimated, after sequential inflation readings reached multi-decade highs.
Despite this, the BOJ’s Governor Haruhiko Kuroda has expressed views that a weak yen is generally positive for the overall Japanese economy. This may be true if resulting inflationary effects help to reverse a “deflationary mindset” prevalent across Japan (where consumption has been delayed in anticipation of prices being lower in the future). The spectre of inflation may induce individuals and businesses to curtail savings and instead purchase goods and services ahead of anticipated higher future prices. Additionally, a weaker yen may also be beneficial by positioning Japanese export goods more competitively relative to global peers.
While a weaker JPY can generally be thought of as positive for Japanese businesses with a high degree of exports, this may not necessarily be as direct of a relationship as intuition would suggest. Analysis of trailing historical correlations for the last 20 years would suggest that the inverse relationship between the value of the yen and gains in the Tokyo Stock Price Index (TOPIX) has varied considerably. While this relationship holds true most of the time (~4/5ths of the period shown below exhibit an inverse relationship), ~1/5th of the observations below exhibit a zero or positive correlation between JPY strength and the TOPIX.
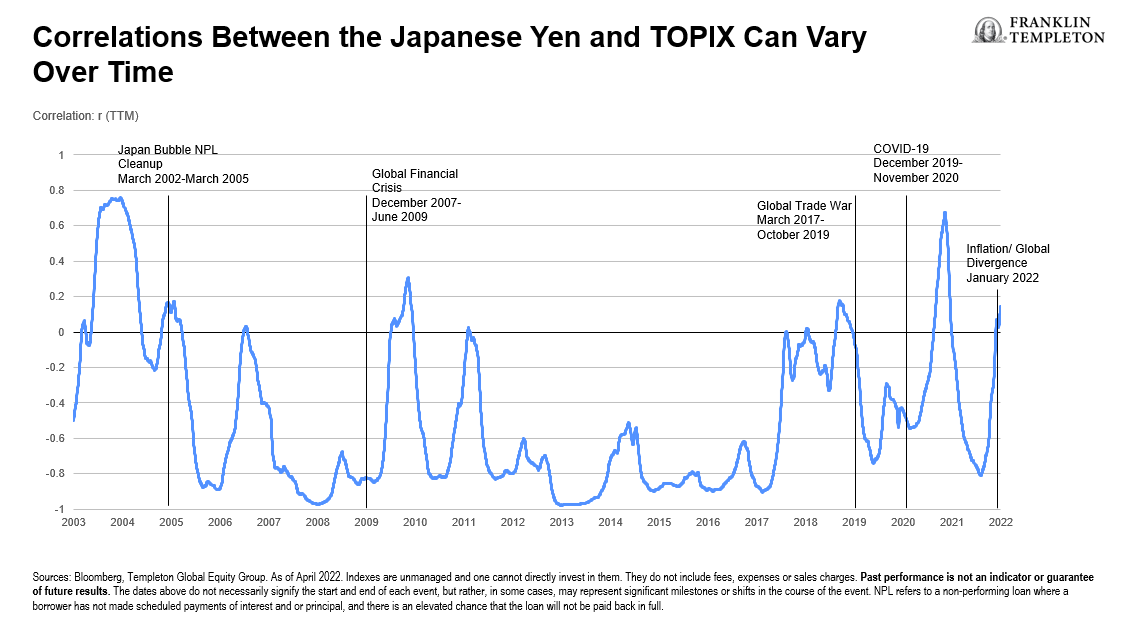
In general, we find that in periods where the global economy is resilient, there tends to be a strong inverse relationship between JPY strength and the TOPIX (i.e.- r= -1), with the logic that a weak JPY facilitates sales to strong end markets.
However, this relationship tends to break down and the correlation coefficient r tends to drift towards 0 (or positive)2, indicating a weak or positive relationship in periods of where there is yen weakness, and more uneven global growth (see global financial crisis, global trade disputes, et al.). This could be potentially the result of either reduced demand from end markets, or protectionist measures.
In the current year-to-date period, we find the expected inverse relationship between the JPY and TOPIX to be more muted, and suspect this may be the result of a more nuanced and unusual combination of factors, including, but not limited to:
- Significant monetary policy divergence between the United States and Japan.
- Material reliance on energy imports, an acute headwind for the country.
- Notable dispersions in demand outlook across Japan’s key export markets.
Accordingly, while it is estimated that companies in the TOPIX derive approximately 40%3 of their revenues from non-JPY sources, a weaker JPY could also potentially result in an erosion of profit margins stemming from extraordinary levels of energy inflation (something which may not be possible to pass on in terms of price increases, or, in doing so, could erode competitive positions). As a result, it is not immediately clear that a weaker yen would necessarily yield higher profits for companies in the TOPIX.
While the observations are not intended to represent a comprehensive analysis on the Japanese yen, this discussion does highlight some nuances of investing in the Japanese market and the sorts of market catalysts that may create investment opportunities.
While considerations such as those outlined above can make selecting individual Japanese equities challenging, we believe the Japanese market can offer valuable geographical diversification within a portfolio and access to a number of unique companies without true competitors. The Japanese market has also been the beneficiary of rising profitability and an increased focus on shareholder returns and corporate governance (See our previous paper “Japan: Land of rising equity opportunities,” for more details).
By adopting a long-term orientation focused on price discipline and identification of value, Templeton Global Equity Group is well positioned, in our view, to take advantage of potential opportunities in Japan, even in a difficult environment such as the current great wave of JPY weakness.
What Are the Risks?
All investments involve risk, including possible loss of principal. The value of investments can go down as well as up, and investors may not get back the full amount invested. Stock prices fluctuate, sometimes rapidly and dramatically, due to factors affecting individual companies, particular industries or sectors, or general market conditions. Investments in foreign securities involve special risks including currency fluctuations, economic instability and political developments. Investments in emerging markets, of which frontier markets are a subset, involve heightened risks related to the same factors, in addition to those associated with these markets’ smaller size, lesser liquidity and lack of established legal, political, business and social frameworks to support securities markets. Because these frameworks are typically even less developed in frontier markets, as well as various factors including the increased potential for extreme price volatility, illiquidity, trade barriers and exchange controls, the risks associated with emerging markets are magnified in frontier markets. Bond prices generally move in the opposite direction of interest rates. Thus, as prices of bonds in an investment portfolio adjust to a rise in interest rates, the value of the portfolio may decline.
Important Legal Information
This material is intended to be of general interest only and should not be construed as individual investment advice or a recommendation or solicitation to buy, sell or hold any security or to adopt any investment strategy. It does not constitute legal or tax advice. This material may not be reproduced, distributed or published without prior written permission from Franklin Templeton.
The views expressed are those of the investment manager and the comments, opinions and analyses are rendered as at publication date and may change without notice. The underlying assumptions and these views are subject to change based on market and other conditions and may differ from other portfolio managers or of the firm as a whole. The information provided in this material is not intended as a complete analysis of every material fact regarding any country, region or market. There is no assurance that any prediction, projection or forecast on the economy, stock market, bond market or the economic trends of the markets will be realized. The value of investments and the income from them can go down as well as up and you may not get back the full amount that you invested. Past performance is not necessarily indicative nor a guarantee of future performance. All investments involve risks, including possible loss of principal.
Any research and analysis contained in this material has been procured by Franklin Templeton for its own purposes and may be acted upon in that connection and, as such, is provided to you incidentally. Data from third party sources may have been used in the preparation of this material and Franklin Templeton (“FT”) has not independently verified, validated or audited such data. Although information has been obtained from sources that Franklin Templeton believes to be reliable, no guarantee can be given as to its accuracy and such information may be incomplete or condensed and may be subject to change at any time without notice. The mention of any individual securities should neither constitute nor be construed as a recommendation to purchase, hold or sell any securities, and the information provided regarding such individual securities (if any) is not a sufficient basis upon which to make an investment decision. FT accepts no liability whatsoever for any loss arising from use of this information and reliance upon the comments, opinions and analyses in the material is at the sole discretion of the user.
Products, services and information may not be available in all jurisdictions and are offered outside the U.S. by other FT affiliates and/or their distributors as local laws and regulation permits. Please consult your own financial professional or Franklin Templeton institutional contact for further information on availability of products and services in your jurisdiction.
Issued in the U.S. by Franklin Distributors, LLC, One Franklin Parkway, San Mateo, California 94403-1906, (800) DIAL BEN/342-5236, franklintempleton.com – Franklin Distributors, LLC, member FINRA/SIPC, is the principal distributor of Franklin Templeton U.S. registered products, which are not FDIC insured; may lose value; and are not bank guaranteed and are available only in jurisdictions where an offer or solicitation of such products is permitted under applicable laws and regulation.
_____________
1. YTD through April 28, 2022.
2. Correlation coefficient (r) refers to a statistical measure of the strength of relationship between two variables and ranges in value between -1 and 1; a measure of -1 suggests a perfectly negative (inverse) relationship, whereas a measure of 1 suggests a positive (direct) relationship. A value of 0 indicates no relationship.
3. Sources: FactSet, Templeton Global Equity Group estimates, As of April 2022. There is no assurance that any estimate, forecast or projection will be realized.