
 English
 简体中文
简体中文
This post is also available in: Chinese (Simplified)
Normal is a term we see appear in the English language in the 17th century as a form to standardize measurement. The Latin word, normalis, is directly referencing something made with a carpenter’s square, forming a right angle.
In the bond market, we also have a tool that defines normal: an upward sloping yield curve. That means that yields on longer-term bonds are higher than those on shorter-dated bank deposits, or Treasury bills and notes. Yield curves are upward sloping to compensate investors for the added risk of tying up their money for longer periods. Longer-term bonds carry greater risk of various potential losses, ranging from inflation to default. Investors therefore normally require an additional return, in the form of higher yields, to offset the risks of venturing out along the yield curve.
Today, however, most parts of the US Treasury yield curve (and many foreign government-bond market curves) are inverted, meaning that short-dated deposits, bills and notes offer higher yields than those on longer-dated bonds.
While a recession has not followed every instance of an inverted curve, the Federal Reserve (Fed) Bank of Chicago has shown that each time the yield spread between 10-year and two-year Treasuries has inverted since 1969, a recession has followed.1
So with today’s deeply inverted yield curve, I thought it was worth exploring three topics at the Franklin Templeton Institute (1) How does this inversion compare to previous episodes (2) What is the historical impact on equities? (3) What is the historical impact on bonds? Based on these observations from the past, we can better evaluate if there was a pattern and whether we can discern any reasons and or lessons for the future.
Cause or effect?
Inverted yield curves are often the by-product of tighter monetary policies. When central banks, such as the US Fed, deem it necessary to hike interest rates to cool overheated economies, their actions cause short-dated interest rates to rise faster than yields on longer maturities.
One might ask why long-term interest rates don’t rise as much (or even more) than short rates when central banks are tightening. A key reason is that modern central banks have garnered considerable credibility in keeping inflation low. When they tighten to fight inflation, investors are quick to conclude that they will triumph, even if the cost of slaying inflation is weaker economic growth, perhaps even recession. Further along the yield curve, therefore, investors must not only discount higher short-term rates due to tighter monetary policy, but also its probable outcomes, above all lower inflation and economic weakness. As a result, when central banks tighten policies, yield curves initially flatten and then often invert, as is the case today.
Presently, the US yield curve is inverted—as measured by the gap between the 10-year Treasury note yield and the two-year Treasury note yield— by nearly three quarters of a percentage point. Relative to history, that is a big negative spread (Exhibit 1). In all previous Fed tightening episodes since 1989, the yield curve has never been as inverted as it is today. The only time in the postwar period when the gap between long and short rates was even more negative was during the early 1980s, when the Fed under its super-hawkish chairman, Paul Volcker, hiked short-term interest rates to 20%!
Exhibit 1: US yield curve since 1976
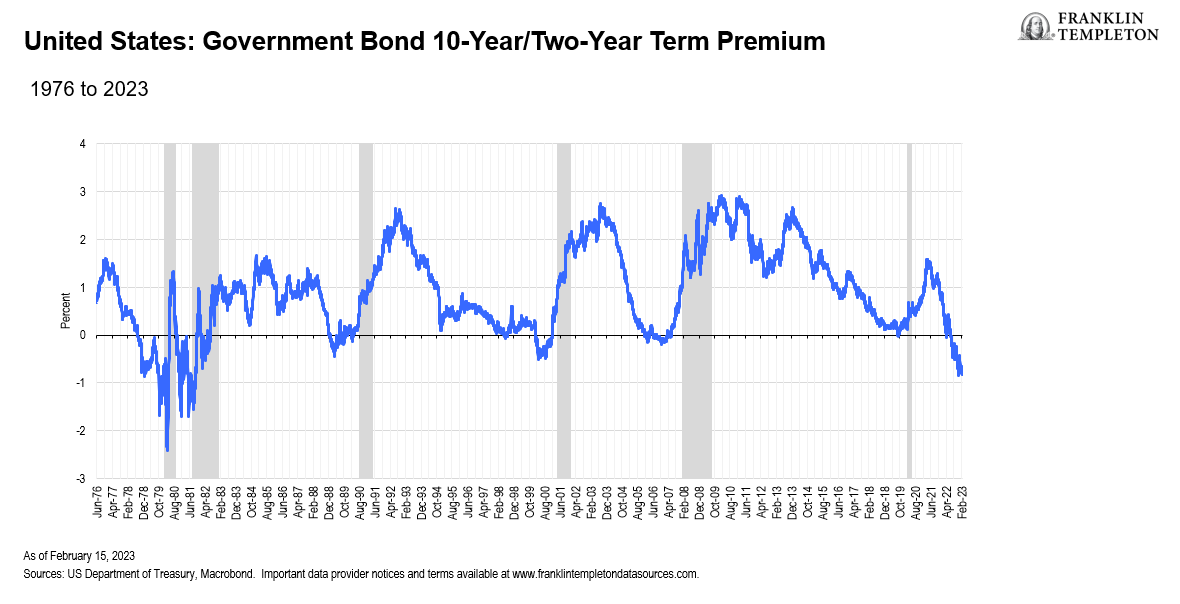
As Exhibit 1 also demonstrates, inverted yield curves are aberrations, not frequent nor long-lasting. The average length of US Treasury yield curve inversion in the postwar era, for example, is eight months.
Stocks and bonds react differently
Accordingly, whenever the yield curve is inverted, investors ought to anticipate its normalization. Moreover, as our research shows, US Treasury yield curve normalization typically takes place in the context of falling interest rates, what Wall Street terms a “bull steepening.” In those instances, both short- and long-term interest rates fall, with the front end (shorter-dated maturities) rallying more than the long end.
Unsurprisingly, therefore, a bull steepening is bullish for fixed income markets. Prices rise along the yield curve (and across many credit markets), boosting fixed income total returns in excess of coupon rates.
One might conclude that equity investors would also be pleased with falling interest rates. All else equal, after all, lower interest rates should boost equity valuations. And US bond yields have fallen in recent months, giving stocks a lift despite slowing profits growth.
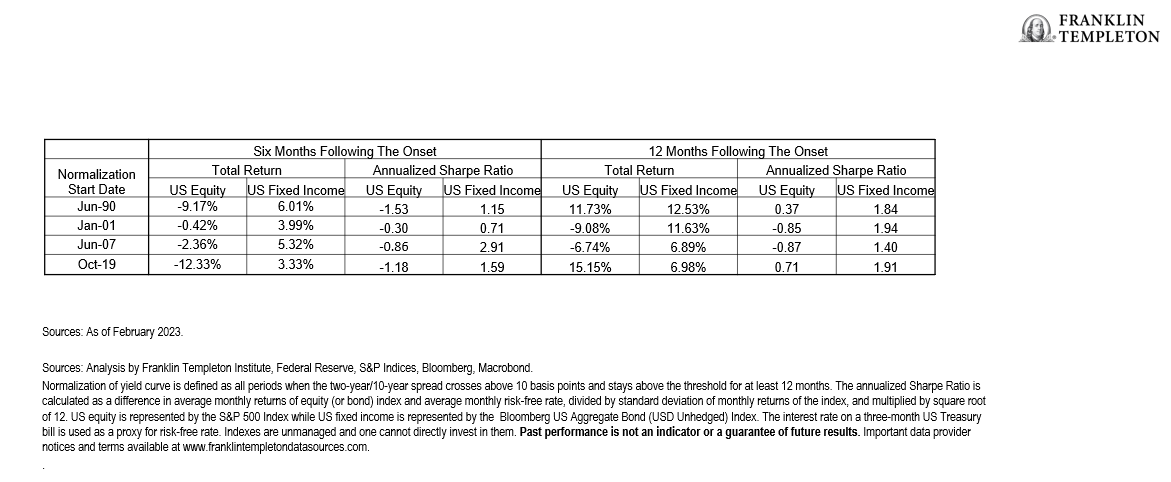
However, history gives us a more nuanced picture. During periods when the yield curve shifts from inverted back to upward sloping, stock markets typically sag. In those same episodes, total returns on bonds top those on equities in absolute and risk-adjusted terms (Exhibit 2).
Exhibit 2: Fixed income and equity returns and Sharpe ratios during periods of yield-curve normalization
That begs the question, why are equities prone to fall when the yield curve normalizes? After all, interest rates (and hence discount rates) are typically falling as the yield curve normalizes, which should be bullish for stocks.
The answer resides in the earlier discussion about the predictive power of the yield curve for recessions and, by extension, for profits. As noted, in preceding cycles dating back to 1970, an inverted yield curve always pre-dated a recession. During those downturns, as the economy weakened and inflation pressures abated, the Fed eventually relented and cut interest rates. But by then it was typically too late to engineer a “soft landing,” where inflation fell but the economy continued to grow.
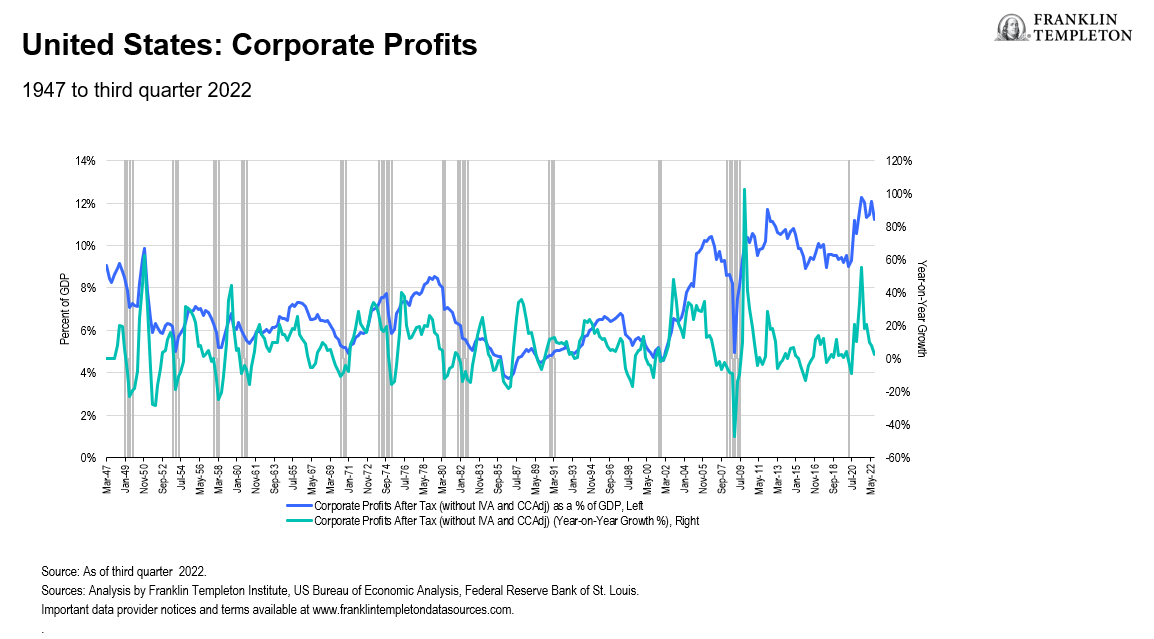
For equities, the real killer is what then happened to corporate profits. Without exception, when the economy fell into recession, economy-wide corporate profits also fell (Exhibit 3). Importantly, as demand weakened, firms lost pricing power, meaning that revenues shrank even faster, especially relative to costs. The outcome was typically a nasty profits recession.
That debacle is evident in Exhibit 3, which shows US corporate profits as a percentage of US gross domestic product (GDP)—a measure of profits to total sales in the economy and a good approximation of aggregate profit margins. In each recession (as indicated by the grey bars), except 1990, profits growth turned negative, exacerbated by a fall in profits relative to sales (i.e., relative to GDP).
Exhibit 3: US profit growth, recessions and profits as a % of GDP
So far in 2023, that is not happening. Indeed, quite the opposite is occurring. This year, despite falling S&P 500 profits at a -5% year-on-year rate for the fourth quarter 2022, equity markets have jumped higher, boosted by expectations of a pause in the Fed’s hiking cycle and hopes that a Fed “pivot” to lower rates will quickly follow.2
To an extent, this year’s rally makes sense. After all, the sooner the Fed pauses, the less damage it will do to the economy and profitability. So, equity investors are right to cheer a slowing in the rate-hiking cycle. And they are also pleased by signs that the economy is not yet buckling, as shown by solid US jobs growth and a remarkable drop in the unemployment rate to a 54-year low of 3.4%.
But equity investors should be wary of becoming overly exuberant. As Fed Chairman Jerome Powell and his Federal Open Market Committee (FOMC) colleagues have repeatedly pointed out, inflation remains too high and, in their view, is unlikely to recede to its target level without some job losses.3The abnormalities in today’s labor market (e.g., lower labor force participation rates) therefore, are keeping the Fed tighter for longer, which only increases recession risk later this year. In short, good news about the economy, which investors are ready to celebrate, could portend even harder times ahead.
Conclusions
History strongly suggests that at this juncture in the monetary policy and economic cycles, yield curves are nearing a point of normalization. Yield curve inversion is not a lasting feature of the capital markets landscape.
History also suggests that during yield curve normalization, bonds outperform stocks in absolute as well as risk-adjusted terms. That’s our view for the next few quarters as well.
A key reason is the risks that lie ahead for corporate profits, which are already falling. They are likely to remain weak for much of 2023. The powerful start for equities in the first six weeks of 2023 has pulled forward into valuations whatever meager good news profits can offer this year, leaving valuations exposed to weaker economic conditions.
Yield curve normalization will only take place once the economy softens. That might take longer than usual, given a very tight labor market. But the risk for investors is a Fed that is “higher for longer,” with pain merely postponed. Still, equity markets might prefer a delayed normalization of the yield curve. After all, when it arrives, it is rarely good for them.
For once, therefore, equity investors might be inclined to think that when it comes to yield curves, abnormal is worth relishing. Enjoy it while it lasts.
WHAT ARE THE RISKS?
All investments involve risks, including possible loss of principal. The value of investments can go down as well as up, and investors may not get back the full amount invested. Stock prices fluctuate, sometimes rapidly and dramatically, due to factors affecting individual companies, particular industries or sectors, or general market conditions. Bond prices generally move in the opposite direction of interest rates. Thus, as prices of bonds in an investment portfolio adjust to a rise in interest rates, the value of the portfolio may decline.
The information provided is not a recommendation or individual investment advice for any particular security, strategy, or investment product and is not an indication of the trading intent of any Franklin Templeton managed portfolio. This is not a complete analysis of every material fact regarding any industry, security or investment and should not be viewed as an investment recommendation. This is intended to provide insight into the portfolio selection and research process. Factual statements are taken from sources considered reliable but have not been independently verified for completeness or accuracy. These opinions may not be relied upon as investment advice or as an offer for any particular security.
IMPORTANT LEGAL INFORMATION
This material is intended to be of general interest only and should not be construed as individual investment advice or a recommendation or solicitation to buy, sell or hold any security or to adopt any investment strategy. It does not constitute legal or tax advice.
The views expressed are those of the investment manager and the comments, opinions and analyses are rendered as at publication date and may change without notice. The information provided in this material is not intended as a complete analysis of every material fact regarding any country, region or market. All investments involve risks, including possible loss of principal.
Data from third party sources may have been used in the preparation of this material and Franklin Templeton (“FT”) has not independently verified, validated or audited such data. FT accepts no liability whatsoever for any loss arising from use of this information and reliance upon the comments opinions and analyses in the material is at the sole discretion of the user.
Products, services and information may not be available in all jurisdictions and are offered outside the U.S. by other FT affiliates and/or their distributors as local laws and regulation permits. Please consult your own financial professional or Franklin Templeton institutional contact for further information on availability of products and services in your jurisdiction.
Issued in the U.S. by Franklin Distributors, LLC, One Franklin Parkway, San Mateo, California 94403-1906, (800) DIAL BEN/342-5236, franklintempleton.com – Franklin Distributors, LLC is the principal distributor of Franklin Templeton U.S. registered products, which are not FDIC insured; may lose value; and are not bank guaranteed and are available only in jurisdictions where an offer or solicitation of such products is permitted under applicable laws and regulation.
Franklin Distributors, LLC
________________________
1. Source: Federal Reserve Bank of Chicago, 2018.
2. Source: FactSet, as of February 10, 2023.
3. Source: US Federal Reserve.