
 English
 Español
This post is also available in: Spanish
Completing our cycle of three webinars on volatility in the banking sector, Kim Catechis, Investment Strategist, Franklin Templeton Institute, gave his perspective on recent events, where we are now, and what the implications are for markets in Europe and globally.
Three weeks after the collapse of Silicon Valley Bank (SVB) and two since UBS took over Credit Suisse, what have we learned?
The markets appear to have largely digested the events of the last three weeks, but investors are reminded of a few banking sector “home truths” that remain constant:
- Banking, like investment, is all about confidence.
While many understand that deposits are (mostly) guaranteed, it is hard for concerned customers not to withdraw cash during periods of market stress. This is why regulators in the United States acted fast and dealt with these concerns comprehensively. Another learning is that confidence in a bank is also built on its capital structure, as well as its capital adequacy. This episode emphasizes the need for trusted institutions and regulatory oversight, both of which international investors appreciate. That is a global phenomenon.
- Recent events might strengthen the arguments against looser regulations.
Until a month ago, there were strident voices in the United States and the United Kingdom demanding looser regulation, in the name of competition. However, in light of recent events, we should expect increased regulation and oversight globally. Some of those new regulations may have the effect of slowing economic growth, and raising the cost of funding for banks and the cost of doing business for entrepreneurs. For those whose deposits were made whole, this may be viewed as a price worth paying.
- Marketable securities will have to be considered riskier than we had thought.
Liquidity in accounting terms comes in many varieties, some of which are not cash at all. While depositors don’t usually consider the balance sheet strength of the bank they choose, from an investor’s standpoint, it appears that this is exactly the sort of depth of due diligence that is required to avoid surprises. When interest rates are rising, US Treasury bills may be safer than equities, but they do not keep pace with future interest rate increases. This mismatch can erode bank liquidity, as it did with SVB.
And now for some charts:
Exhibit 1: Seven Sigma Move on the Front End of the Yield Curve
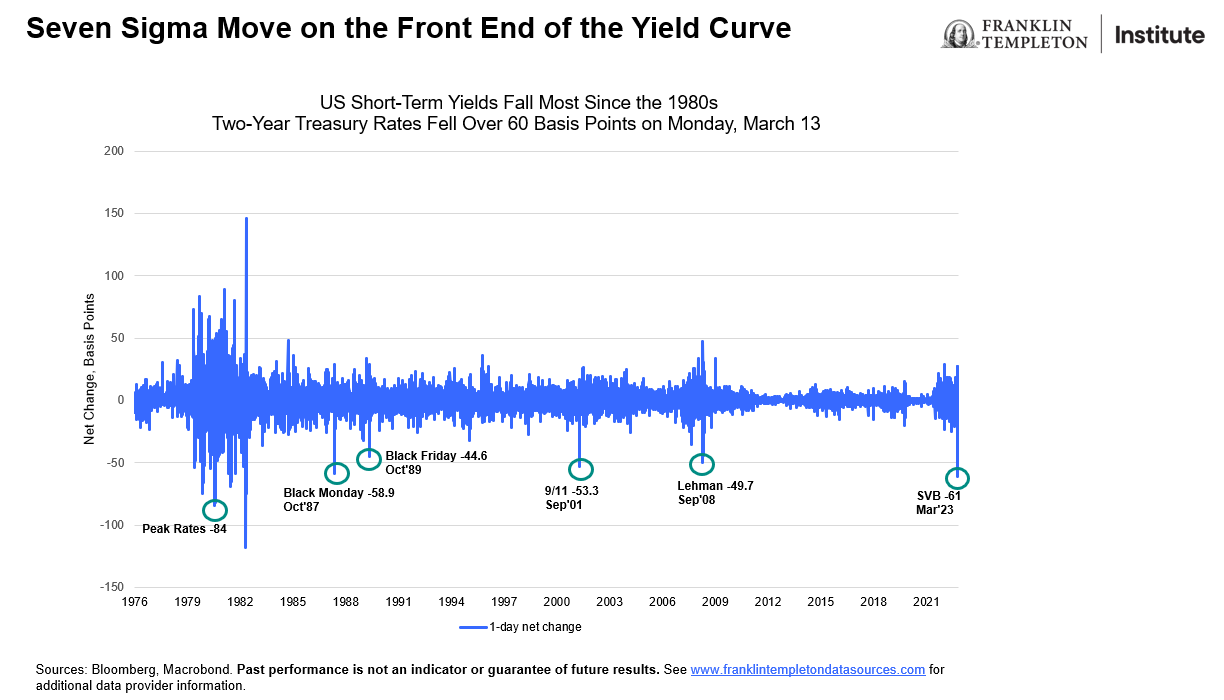
Over the last few weeks, sharp moves at the front end of the yield curve led to a significant plunge in Treasury yields. The market clearly thought that there was a problem with the short-term rates and expected the Federal Reserve (Fed) to ease monetary policy soon. We experienced a seven-standard-deviation move on the front end of the yield curve for the first time since 1987 as two-year yields dropped 60 basis points (bps). On March 8, SVB announced it would book a US$1.8 billion loss after selling some of its investments to cover increasing withdrawals; within 48 hours California state regulators and the Federal Deposit Insurance Corporation had intervened. The biggest drop in the two-year US Treasury yield was on March 13, as investors got a chance to express their view that the Fed was wrong and should cut rates immediately.
Exhibit 2: Tug of War Between the Fed and Markets
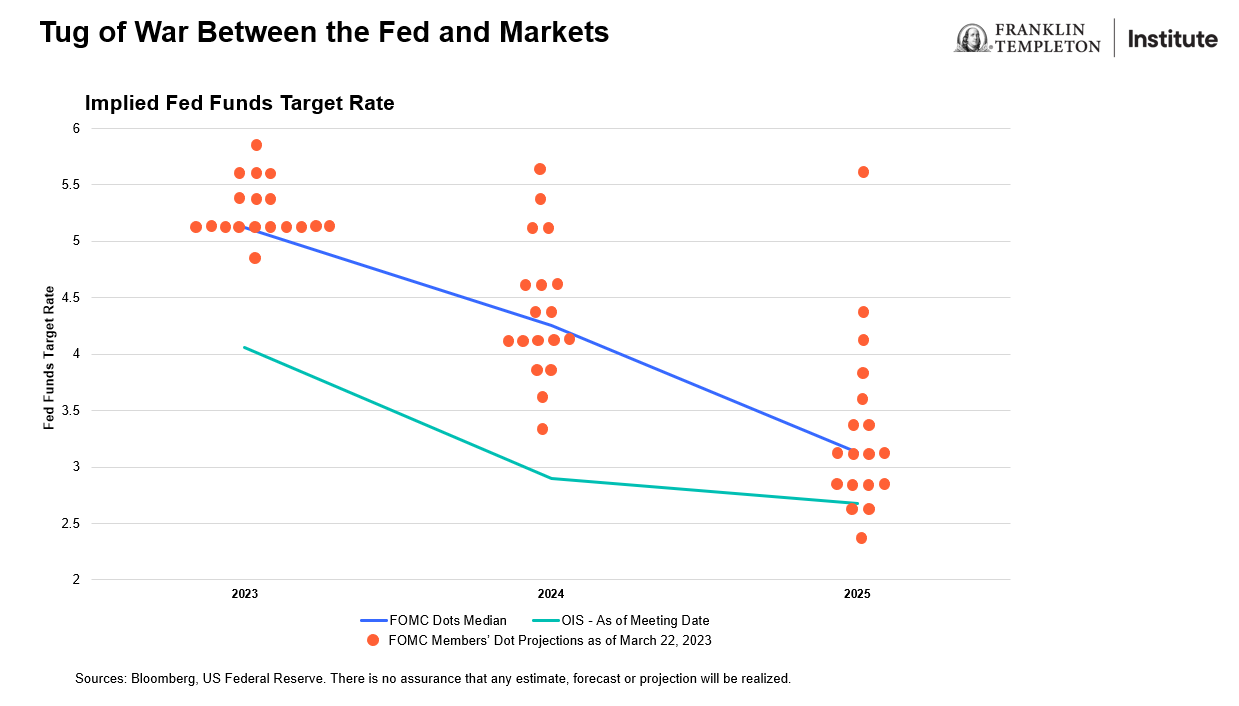
Exhibit 2 is the famous “dot plot” chart, where each orange dot represents the view of a Federal Open Market Committee (FOMC) member on the appropriate level for the fed funds rate. The median of these views is illustrated by the blue line.
The green line represents market expectations; these are based on the overnight index swaps (OIS) market.
The chart shows that the Fed and fixed income markets differ significantly in terms of their assessment of the right level for the terminal interest rate. The market has been consistently pricing a more dovish path for interest-rate hikes since the third quarter of 2021; however, the gap between the market and the FOMC projections has been increasing and it is now (as of FOMC meeting on March 22) over 100 bps. In other words, the FOMC members think that one more hike (25 bps) is appropriate in 2023, while the market believes the Fed target rates should drop by approximately 100 bps from where we are today. This divergence is important for investors, as expected returns are dependent on which of these two paths will eventually materialize. Of course, we all know that these expectations fluctuate daily, so please do not treat them as carved in stone!
Exhibit 3: Money Markets In, Bank Deposits Out
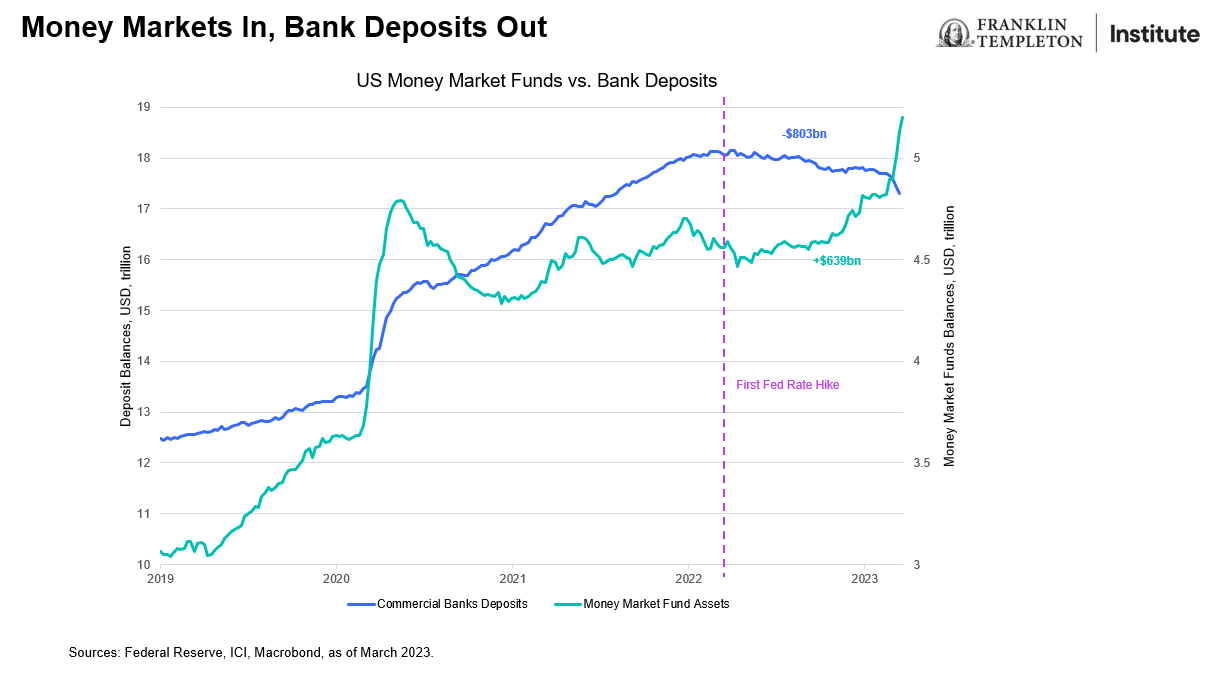
This chart shows the increasing switch out of bank deposits and into money market mutual funds. On one level, depositors are diversifying their accounts among commercial banks because they are looking for deposit guarantees, yet money market funds continue to attract inflows because of slightly higher yields. Deposit rates have broadly started to rise, but they remain below money market mutual fund yields, implying that outflows of bank deposits will probably continue. The 14% increase in money market fund balances (US$639 billion) since March 2022 (first Fed rate hike) compares with a 5% decline (US$803 billion) in US commercial bank deposits. [Deposit data trails money market fund figures by seven days.] This deposit flight may cause banks to either continue to raise rates to maintain deposit levels, or to restrict lending.
Exhibit 4: Treasuries Versus Equities
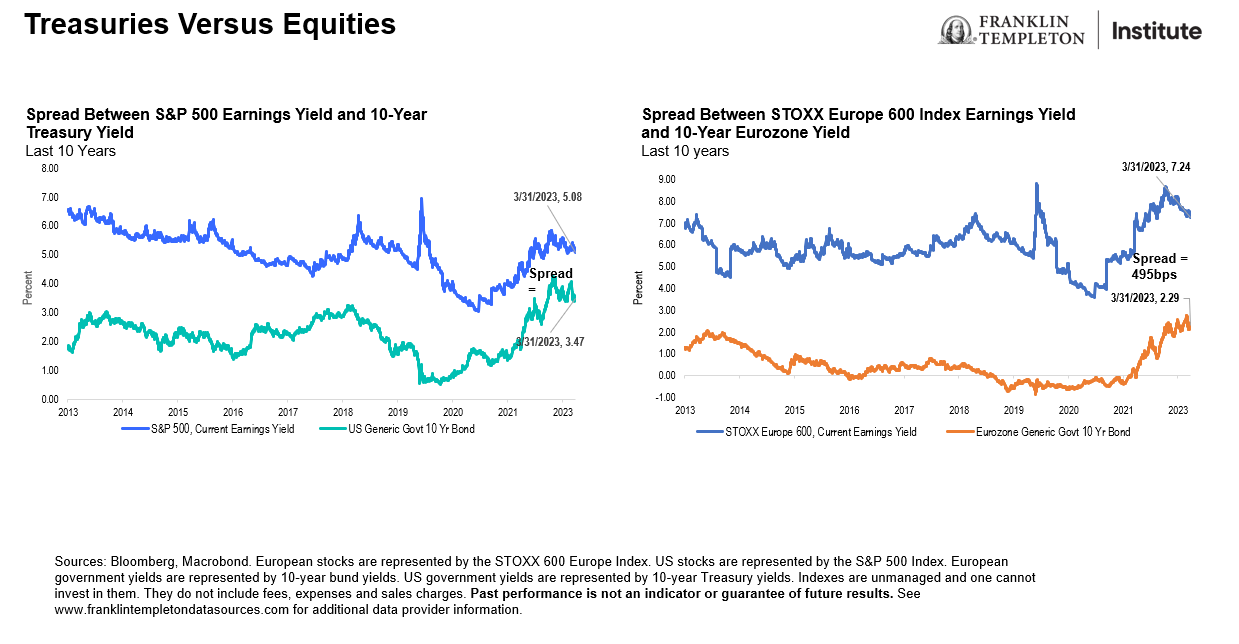
Asset allocators often compare the relative attractions of bonds versus equities. The current spread between the earnings yield on the S&P 500 Index and the 10-year Treasury yield has contracted to around 161 bps. Investors consider this to be the risk premium, or the compensation investors get for the greater risk and volatility of equities over government bonds. This now stands at 1.6 standard deviations below the 10-year mean. The implication is that the case for stocks is weakened. Historical analysis suggests that investors typically take this as an attractive entry point for Treasuries.
In Europe, the story is less clear, as you can see from the right-hand side of Figure 4. The spread between equity earnings yield and the 10-year Bund yield is 495 bps, which means that it is 0.5 standard deviations below the mean over a 10-year period. The spread is somewhat lower; however, statistically speaking, we cannot say that it has reached extreme territory, which means that the signals for asset allocators are inconclusive.
WHAT ARE THE RISKS?
All investments involve risks, including possible loss of principal. The value of investments can go down as well as up, and investors may not get back the full amount invested.
Stock prices fluctuate, sometimes rapidly and dramatically, due to factors affecting individual companies, particular industries or sectors, or general market conditions.
Bond prices generally move in the opposite direction of interest rates. Thus, as prices of bonds in an investment portfolio adjust to a rise in interest rates, the value of the portfolio may decline. Investments in lower-rated bonds include higher risk of default and loss of principal. Changes in the credit rating of a bond, or in the credit rating or financial strength of a bond’s issuer, insurer or guarantor, may affect the bond’s value. In general, an investor is paid a higher yield to assume a greater degree of credit risk. The risks associated with higher-yielding, lower-rated debt securities include higher risk of default and loss of principal. Investments in foreign securities involve special risks including currency fluctuations, economic instability and political developments.
Any companies and/or case studies referenced herein are used solely for illustrative purposes; any investment may or may not be currently held by any portfolio advised by Franklin Templeton. The information provided is not a recommendation or individual investment advice for any particular security, strategy, or investment product and is not an indication of the trading intent of any Franklin Templeton managed portfolio.
IMPORTANT LEGAL INFORMATION
This material is intended to be of general interest only and should not be construed as individual investment advice or a recommendation or solicitation to buy, sell or hold any security or to adopt any investment strategy. It does not constitute legal or tax advice. This material may not be reproduced, distributed or published without prior written permission from Franklin Templeton.
The views expressed are those of the investment manager and the comments, opinions and analyses are rendered as at publication date and may change without notice. The underlying assumptions and these views are subject to change based on market and other conditions and may differ from other portfolio managers or of the firm as a whole. The information provided in this material is not intended as a complete analysis of every material fact regarding any country, region or market. There is no assurance that any prediction, projection or forecast on the economy, stock market, bond market or the economic trends of the markets will be realized. The value of investments and the income from them can go down as well as up and you may not get back the full amount that you invested. Past performance is not necessarily indicative nor a guarantee of future performance. All investments involve risks, including possible loss of principal.
Any research and analysis contained in this material has been procured by Franklin Templeton for its own purposes and may be acted upon in that connection and, as such, is provided to you incidentally. Data from third party sources may have been used in the preparation of this material and Franklin Templeton (“FT”) has not independently verified, validated or audited such data. Although information has been obtained from sources that Franklin Templeton believes to be reliable, no guarantee can be given as to its accuracy and such information may be incomplete or condensed and may be subject to change at any time without notice. The mention of any individual securities should neither constitute nor be construed as a recommendation to purchase, hold or sell any securities, and the information provided regarding such individual securities (if any) is not a sufficient basis upon which to make an investment decision. FT accepts no liability whatsoever for any loss arising from use of this information and reliance upon the comments, opinions and analyses in the material is at the sole discretion of the user.
Products, services and information may not be available in all jurisdictions and are offered outside the U.S. by other FT affiliates and/or their distributors as local laws and regulation permits. Please consult your own financial professional or Franklin Templeton institutional contact for further information on availability of products and services in your jurisdiction.
CFA® and Chartered Financial Analyst® are trademarks owned by CFA Institute.