
 English
 简体中文
简体中文
Key takeaways:
- The Federal Reserve (Fed) is now more focused on normalizing its policy and its dual mandate of price stability and maximizing employment.
- We believe investment-grade bonds offer diversification benefits as well as compelling yields and long-term total return potential.
- Within equities, we see opportunities in high-quality dividend companies that offer what we consider attractive valuations.
- Given continued uncertainty, we aim to dynamically shift between asset classes as market conditions change.
Interesting changes in the Fed’s stance
Although investors didn’t expect a change in the fed funds rate at the January Federal Open Market Committee (FOMC) meeting, there were a couple of things we found interesting compared to prior FOMC statements. The Committee removed the statement regarding evaluating economic data to determine if additional policy firming may be appropriate. And it added a statement saying that it doesn’t think it’s appropriate to reduce the policy rate right now but may pivot once Fed policymakers gain further confidence that inflation is under control.
Based on these changes, it seems to us that the Fed thinks it is far enough along in fighting inflation that it can start thinking more broadly about the overall economy. The Fed is now more focused on normalizing its policy and its dual mandate of price stability and maximizing employment. In our opinion, with Fed Chair Jerome Powell stopping short of declaring that inflation is dead and the strength of the economy is giving the Fed a “free pass” to not cut rates and continue to evaluate, it feels like a “Goldilocks” condition where the Fed can hold, then cut carefully when it deems appropriate. And, we should not see major deterioration in the labor market.
Recent performance of US markets and anticipated trajectory for interest rates
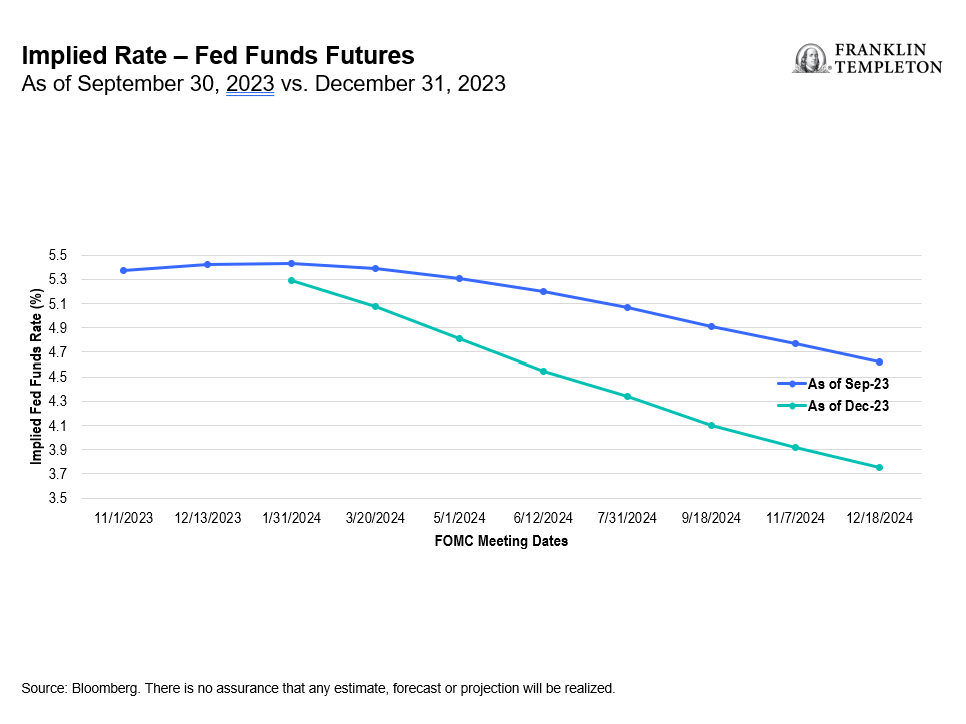
The Fed’s policy actions continue to be front and center for both the fixed income and equity markets. Looking at the fed funds futures at the end of September 2023, there was quite a bit of concern that inflation was not cooling toward the Fed’s target in a meaningful or quick-enough way. Investors had expected rate cuts at the end of 2024 or even into 2025. However, that flipped significantly by year-end, which shows how quickly markets can swing—and both fixed income and equity markets benefited.
Markets rallied significantly during the fourth quarter of 2023 as moderating inflation lifted investors’ expectations for earlier rate cuts in 2024. Resilience in the labor market led to investor optimism that the Fed can maneuver the US economy into a soft landing. Fixed income markets delivered positive total returns in 2023, with strong contributions from both investment-grade and high-yield corporate bonds. Equity markets experienced a broader rally during the second half of 2023, ending the year with notable performance from the financials and industrials sectors.
Updating this to where we are currently, we believe we’re in between these two projections. Currently, markets are no longer pricing in a rate cut in March. The economy continues to perform well, and we haven’t seen degradation in real gross domestic product growth that many had expected. The labor market has only had a very modest softening.
Given this scenario, the markets currently expect that the Fed may cut rates by 25 basis points (bps) in May, June and July. That puts the timeline out to the end of summer and the following FOMC meeting wouldn’t be until mid-September. In our analysis, this is a minimal amount of rate cuts and not a radical move that would risk reigniting inflation.
Exhibit 1: Evolving Interest-Rate Expectations (click on chart to enlarge)
Fixed income yields and total return potential
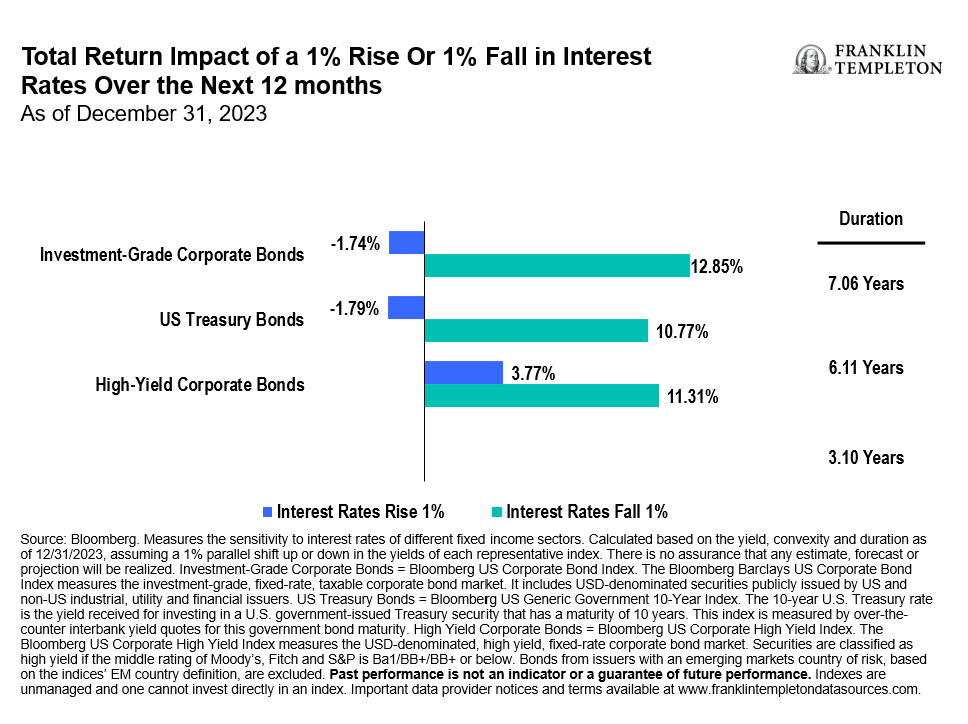
The power of duration has worked both ways in the past couple of years. It was important for investors to stay focused on duration when rates were at the bottom in 2022, which did a lot of damage to bond prices. But as yields rose in 2023, duration became a powerful addition to potential returns. Additionally, looking at this in the context of what’s happened in the markets, a tremendous amount of money moved into money market funds because money-market yields were very attractive. However, we believe investors should recognize that when the Fed begins cutting rates, money-market yields will come down very rapidly.
In regard to the sensitivity of fixed income investments to shifts in interest rates, with all else being equal, our analysis (as shown in the chart below) as of December 31, 2023, indicates that an interest-rate rise of 100 bps could lead to small declines for investment-grade corporate bonds and US Treasury bonds and a moderate increase for high-yield corporate bonds.1 In contrast, a 100-bps decline in interest rates could significantly benefit all three asset classes.2 In our opinion, this attractive, asymmetric profile for these assets shows the power of coupon. The average coupon has been steadily climbing, and we expect this to continue for the majority of 2024. Interestingly, the average yield to worst of high-yield bonds around 22 years ago is the same as it is today.3 So we think that fixed income can generate attractive returns that have less volatility associated with them than equity markets. At the same time, investment-grade bonds continue to also trade at what we consider attractive prices.
Exhibit 2: Fixed Income Total Return Potential (click on chart to enlarge)
Relative value comparison between fixed income and equities
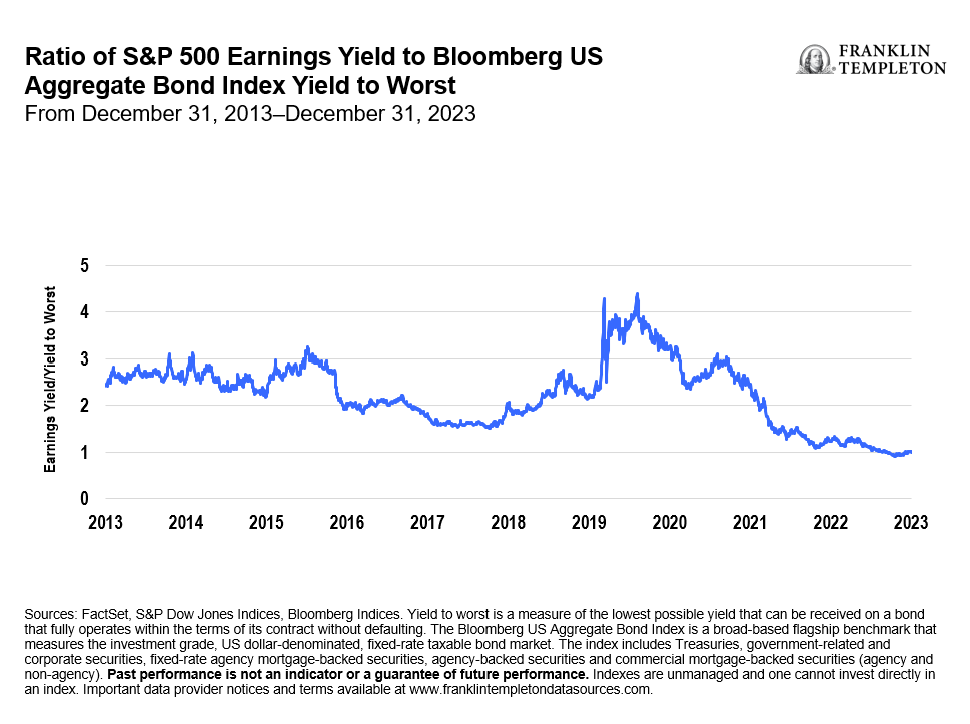
The increased market weightings of bigger technology companies have certainly impacted the cross-asset relative value of markets, and we can see how much the Magnificent Seven4 has been impacting broad market equity valuations. When we compare the S&P 500 earnings yield to the yield to worst of the Bloomberg US Aggregate Bond Index (Agg),5 the relative valuation for fixed income looks quite attractive to us, and stepping back historically, it appears pretty compelling to us in this trailing 10- and even 20-year period.
Exhibit 3: Cross Asset Relative Value (click on chart to enlarge)
Equity earnings performance and market expectations
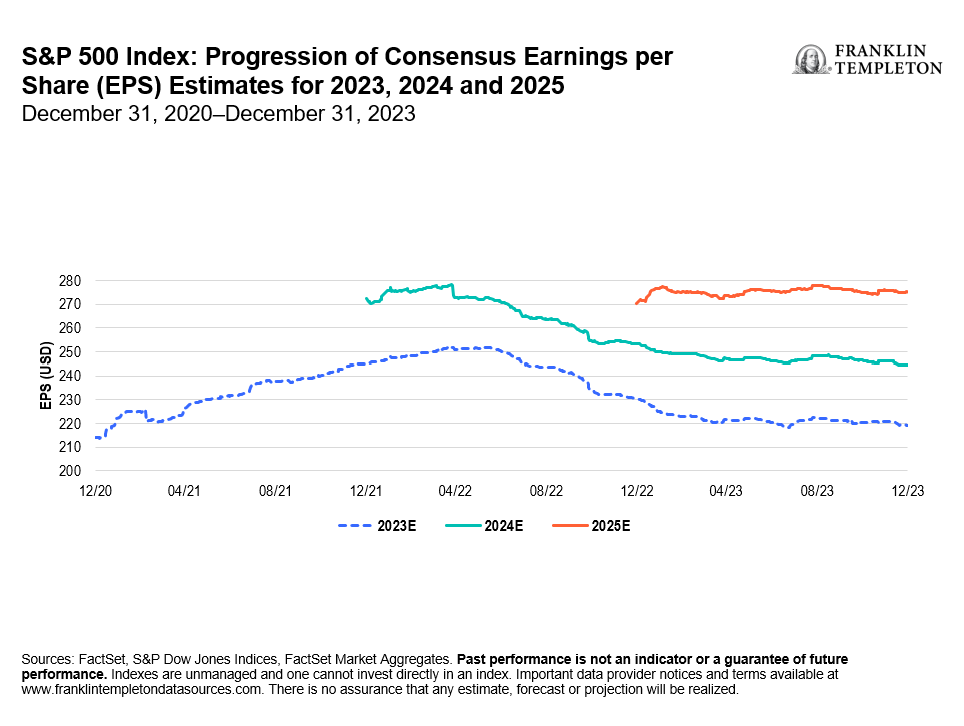
The overall equity market looked healthy at the end of 2023. However, as mentioned earlier, there was a small cohort of companies that have been doing the heavy lifting with outsized year-over-year earnings. These include technology, internet retail and media internet companies. In contrast, cyclical sectors like energy, materials, industrials and consumer discretionary ex-internet retail had significant negative returns, while non-cyclicals like consumer staples, health care and utilities were relatively flat.
In terms of earnings expectations going forward, we believe low double digits are potentially achievable given the kind of economic growth that the markets and the Fed are expecting. But we would like to see more broadening of market health rather than a small cohort of companies with outsized year-over-year earnings. This is because we believe the health of the consumer, while it’s been incredibly resilient, is back to pre-pandemic levels as it relates to excess liquidity and the power to drive the economy.
Exhibit 4: Consensus Estimates for Growth (click on chart to enlarge)
Changes in our asset-mix strategy
Our conviction on the income and growth potential of both fixed income and equities influences any changes to our positioning. Recently, we have been increasing our exposure to investment-grade corporate bonds, while decreasing exposure to Treasuries and high-yield corporates. In our analysis, high-quality fixed income assets provide diversification benefits, compelling income opportunities and longer-term total return potential. We’ve decreased our equity exposure but maintain a diversified exposure to equity sectors that we believe can generate income and participate in a broad market rally. Additionally, we see opportunities with high-quality dividend names where, in our analysis, valuations have become more palatable.
WHAT ARE THE RISKS?
All investments involve risks, including possible loss of principal. Equity securities are subject to price fluctuation and possible loss of principal. Dividends may fluctuate and are not guaranteed, and a company may reduce or eliminate its dividend at any time. Fixed income securities involve interest rate, credit, inflation and reinvestment risks, and possible loss of principal. As interest rates rise, the value of fixed income securities falls. Low-rated, high-yield bonds are subject to greater price volatility, illiquidity and possibility of default.
IMPORTANT LEGAL INFORMATION
This material is intended to be of general interest only and should not be construed as individual investment advice or a recommendation or solicitation to buy, sell or hold any security or to adopt any investment strategy. It does not constitute legal or tax advice. This material may not be reproduced, distributed or published without prior written permission from Franklin Templeton.
The views expressed are those of the investment manager and the comments, opinions and analyses are rendered as at publication date and may change without notice. The underlying assumptions and these views are subject to change based on market and other conditions and may differ from other portfolio managers or of the firm as a whole. The information provided in this material is not intended as a complete analysis of every material fact regarding any country, region or market. There is no assurance that any prediction, projection or forecast on the economy, stock market, bond market or the economic trends of the markets will be realized. The value of investments and the income from them can go down as well as up and you may not get back the full amount that you invested. Past performance is not necessarily indicative nor a guarantee of future performance. All investments involve risks, including possible loss of principal.
Any research and analysis contained in this material has been procured by Franklin Templeton for its own purposes and may be acted upon in that connection and, as such, is provided to you incidentally. Data from third party sources may have been used in the preparation of this material and Franklin Templeton (“FT”) has not independently verified, validated or audited such data. Although information has been obtained from sources that Franklin Templeton believes to be reliable, no guarantee can be given as to its accuracy and such information may be incomplete or condensed and may be subject to change at any time without notice. The mention of any individual securities should neither constitute nor be construed as a recommendation to purchase, hold or sell any securities, and the information provided regarding such individual securities (if any) is not a sufficient basis upon which to make an investment decision. FT accepts no liability whatsoever for any loss arising from use of this information and reliance upon the comments, opinions and analyses in the material is at the sole discretion of the user.
Products, services and information may not be available in all jurisdictions and are offered outside the U.S. by other FT affiliates and/or their distributors as local laws and regulation permits. Please consult your own financial professional or Franklin Templeton institutional contact for further information on availability of products and services in your jurisdiction.
CFA® and Chartered Financial Analyst® are trademarks owned by CFA Institute.
__________
1. Source: Bloomberg, as of December 31, 2023. Past performance is not an indicator or a guarantee of future performance. Indexes are unmanaged and one cannot invest directly in an index. Important data provider notices and terms available at www.franklintempletondatasources.com.
2. Ibid.
3. Source: Bloomberg, as of December 31, 2023. Yield to worst is a measure of the lowest possible yield that can be received on a bond that fully operates within the terms of its contract without defaulting. Past performance is not an indicator or a guarantee of future performance. Indexes are unmanaged and one cannot invest directly in an index. Important data provider notices and terms available at www.franklintempletondatasources.com.
4. The Magnificent Seven are Apple, Amazon, Alphabet, Meta, Microsoft, NVIDIA and Tesla.
5. Source: Bloomberg, as of December 31, 2023. The Bloomberg US Aggregate Bond Index is a broad-based flagship benchmark that measures the investment grade, US dollar-denominated, fixed-rate taxable bond market. The index includes Treasuries, government-related and corporate securities, fixed-rate agency mortgage-backed securities, agency-backed securities and commercial mortgage-backed securities (agency and non-agency). Past performance is not an indicator or a guarantee of future performance. Indexes are unmanaged and one cannot invest directly in an index. Important data provider notices and terms available at www.franklintempletondatasources.com.